RBS 2006 Annual Report Download - page 229
Download and view the complete annual report
Please find page 229 of the 2006 RBS annual report below. You can navigate through the pages in the report by either clicking on the pages listed below, or by using the keyword search tool below to find specific information within the annual report.-
 1
1 -
2
-
3
-
4
-
5
-
6
-
7
-
8
-
9
-
10
-
11
-
12
-
13
-
14
-
15
-
16
-
17
-
18
-
19
-
20
-
21
-
22
-
23
-
24
-
25
-
26
-
27
-
28
-
29
-
30
-
31
-
32
-
33
-
34
-
35
-
36
-
37
-
38
-
39
-
40
-
41
-
42
-
43
-
44
-
45
-
46
-
47
-
48
-
49
-
50
-
51
-
52
-
53
-
54
-
55
-
56
-
57
-
58
-
59
-
60
-
61
-
62
-
63
-
64
-
65
-
66
-
67
-
68
-
69
-
70
-
71
-
72
-
73
-
74
-
75
-
76
-
77
-
78
-
79
-
80
-
81
-
82
-
83
-
84
-
85
-
86
-
87
-
88
-
89
-
90
-
91
-
92
-
93
-
94
-
95
-
96
-
97
-
98
-
99
-
100
-
101
-
102
-
103
-
104
-
105
-
106
-
107
-
108
-
109
-
110
-
111
-
112
-
113
-
114
-
115
-
116
-
117
-
118
-
119
-
120
-
121
-
122
-
123
-
124
-
125
-
126
-
127
-
128
-
129
-
130
-
131
-
132
-
133
-
134
-
135
-
136
-
137
-
138
-
139
-
140
-
141
-
142
-
143
-
144
-
145
-
146
-
147
-
148
-
149
-
150
-
151
-
152
-
153
-
154
-
155
-
156
-
157
-
158
-
159
-
160
-
161
-
162
-
163
-
164
-
165
-
166
-
167
-
168
-
169
-
170
-
171
-
172
-
173
-
174
-
175
-
176
-
177
-
178
-
179
-
180
-
181
-
182
-
183
-
184
-
185
-
186
-
187
-
188
-
189
-
190
-
191
-
192
-
193
-
194
-
195
-
196
-
197
-
198
-
199
-
200
-
201
-
202
-
203
-
204
-
205
-
206
-
207
-
208
-
209
-
210
-
211
-
212
-
213
-
214
-
215
-
216
-
217
-
218
-
 219
219 -
 220
220 -
 221
221 -
 222
222 -
 223
223 -
 224
224 -
 225
225 -
 226
226 -
 227
227 -
 228
228 -
 229
229 -
 230
230 -
 231
231 -
 232
232 -
 233
233 -
 234
234 -
 235
235 -
 236
236 -
 237
237 -
 238
238 -
 239
239 -
240
-
241
-
242
-
243
-
244
-
245
-
246
-
247
-
248
-
249
-
250
-
251
-
252
-
253
-
254
-
255
-
256
-
257
-
258
-
259
-
260
-
261
-
262
 |
 |
RBS Group • Annual Report and Accounts 2006
228
Additional information continued
Additional information
Amounts in accordance with IFRS (continued)
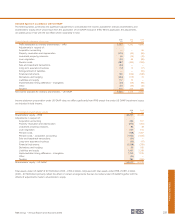
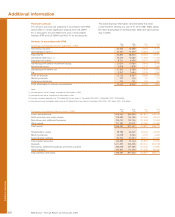
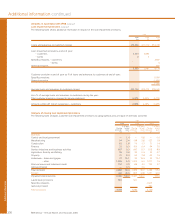
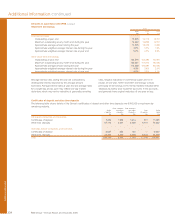
Analysis of loans and advances to customers – IFRS
The following table analyses loans and advances to customers before provisions by remaining maturity, geographical area and
type of customer. Overdrafts are included in the ‘Within 1 year’ category.
After 1
Within but within After 2006
1 year 5 years 5 years Total 2005 2004
£m £m £m £m £m £m
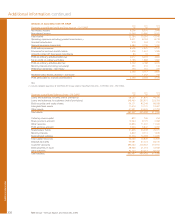
UK
Central and local government 6,573 2 157 6,732 3,340 1,866
Manufacturing 9,768 582 701 11,051 11,615 6,292
Construction 6,271 1,037 943 8,251 7,274 5,024
Finance 23,522 938 557 25,017 27,091 24,638
Service industries and business activities 26,603 8,446 8,838 43,887 40,687 30,867
Agriculture, forestry and fishing 1,275 542 950 2,767 2,645 2,481
Property 26,767 6,559 5,970 39,296 32,899 26,448
Individuals – home mortgages 19,542 2,055 49,287 70,884 65,286 57,535
Individuals – other 11,537 3,783 12,602 27,922 26,323 26,459
Finance leases and instalment credit 3,175 4,410 6,633 14,218 13,909 13,044
Accrued interest 1,308 104 85 1,497 1,250
Total domestic 136,341 28,458 86,723 251,522 232,319 194,654
Overseas residents 64,558 2,450 2,234 69,242 52,234 48,183
Total UK offices 200,899 30,908 88,957 320,764 284,553 242,837
Overseas
US 38,706 20,481 32,979 92,166 90,606 74,027
Rest of the World 27,832 10,266 19,798 57,896 45,951 34,555
Total Overseas offices 66,538 30,747 52,777 150,062 136,557 108,582
Loans and advances to customers – gross 267,437 61,655 141,734 470,826 421,110 351,419
Loan impairment provisions (3,933) (3,884) (4,168)
Loans and advances to customers – net 466,893 417,226 347,251
Fixed rate 45,644 24,480 45,116 115,240 100,748 101,227
Variable rate 221,793 37,175 96,618 355,586 320,362 250,192
Loans and advances to customers – gross 267,437 61,655 141,734 470,826 421,110 351,419
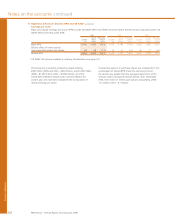
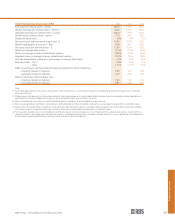
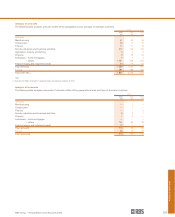
Cross border exposures
Cross border exposures are defined as loans to banks and
customers (including finance lease and instalment credit
receivables) and other monetary assets, including non-local
currency claims of overseas offices on local residents.
The Group monitors the geographical breakdown of these
exposures based on the country of domicile of the borrower or
guarantor of ultimate risk.
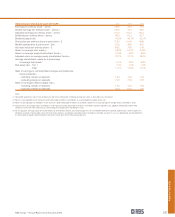
The table below sets out the Group’s cross border
outstandings in excess of 0.75% of Group total assets
(including acceptances), which totalled £871.4 billion at 31
December 2006 (2005 – £776.8 billion; 2004 – £588.5 billion).
None of these countries has experienced repayment
difficulties that have required refinancing of outstanding debt.
2006 2005 2004
£m £m £m
United States 43,718 34,246 28,795
Germany 20,130 18,395 14,050
France 18,136 13,402 9,604
Netherlands 12,407 8,026 8,871
Spain 9,341 7,392 5,249
Cayman Islands 9,063 11,813 7,258
Republic of Ireland 8,530 6,008 *
Norway 7,768 **
Japan 7,725 **
Italy 7,506 **
Switzerland 7,262 7,061 *
China 6,574 **
* Less than 0.75% of Group total assets.