RBS 2006 Annual Report Download - page 160
Download and view the complete annual report
Please find page 160 of the 2006 RBS annual report below. You can navigate through the pages in the report by either clicking on the pages listed below, or by using the keyword search tool below to find specific information within the annual report.-
 1
1 -
2
-
3
-
4
-
5
-
6
-
7
-
8
-
9
-
10
-
11
-
12
-
13
-
14
-
15
-
16
-
17
-
18
-
19
-
20
-
21
-
22
-
23
-
24
-
25
-
26
-
27
-
28
-
29
-
30
-
31
-
32
-
33
-
34
-
35
-
36
-
37
-
38
-
39
-
40
-
41
-
42
-
43
-
44
-
45
-
46
-
47
-
48
-
49
-
50
-
51
-
52
-
53
-
54
-
55
-
56
-
57
-
58
-
59
-
60
-
61
-
62
-
63
-
64
-
65
-
66
-
67
-
68
-
69
-
70
-
71
-
72
-
73
-
74
-
75
-
76
-
77
-
78
-
79
-
80
-
81
-
82
-
83
-
84
-
85
-
86
-
87
-
88
-
89
-
90
-
91
-
92
-
93
-
94
-
95
-
96
-
97
-
98
-
99
-
100
-
101
-
102
-
103
-
104
-
105
-
106
-
107
-
108
-
109
-
110
-
111
-
112
-
113
-
114
-
115
-
116
-
117
-
118
-
119
-
120
-
121
-
122
-
123
-
124
-
125
-
126
-
127
-
128
-
129
-
130
-
131
-
132
-
133
-
134
-
135
-
136
-
137
-
138
-
139
-
140
-
141
-
142
-
143
-
144
-
145
-
146
-
147
-
148
-
149
-
 150
150 -
 151
151 -
 152
152 -
 153
153 -
 154
154 -
 155
155 -
 156
156 -
 157
157 -
 158
158 -
 159
159 -
 160
160 -
 161
161 -
 162
162 -
 163
163 -
 164
164 -
 165
165 -
 166
166 -
 167
167 -
 168
168 -
 169
169 -
 170
170 -
171
-
172
-
173
-
174
-
175
-
176
-
177
-
178
-
179
-
180
-
181
-
182
-
183
-
184
-
185
-
186
-
187
-
188
-
189
-
190
-
191
-
192
-
193
-
194
-
195
-
196
-
197
-
198
-
199
-
200
-
201
-
202
-
203
-
204
-
205
-
206
-
207
-
208
-
209
-
210
-
211
-
212
-
213
-
214
-
215
-
216
-
217
-
218
-
219
-
220
-
221
-
222
-
223
-
224
-
225
-
226
-
227
-
228
-
229
-
230
-
231
-
232
-
233
-
234
-
235
-
236
-
237
-
238
-
239
-
240
-
241
-
242
-
243
-
244
-
245
-
246
-
247
-
248
-
249
-
250
-
251
-
252
-
253
-
254
-
255
-
256
-
257
-
258
-
259
-
260
-
261
-
262
 |
 |

159
RBS Group • Annual Report and Accounts 2006
Financial statements
2006 2005
£m £m
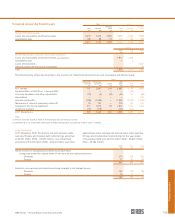
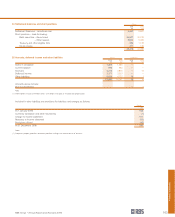
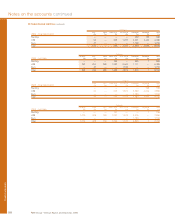
Contracts for future capital expenditure not provided for in the accounts
at the year end (excluding investment properties and operating lease assets) 117 38
Contractual obligations to purchase, construct or develop investment
properties or to repair, maintain or enhance investment properties 6 4
Property, plant and equipment pledged as security 1,222 1,250
Investment properties are valued to reflect fair value, that is,
the market value of the Group’s interest at the reporting date
excluding any special terms or circumstances relating to the
use or financing of the property and transaction costs that
would be incurred in making a sale. Observed market data
such as rental yield, replacement cost and useful life, reflect
relatively few transactions involving property that, necessarily,
is not identical to property owned by the Group.
Valuations are carried out by qualified surveyors who are
members of the Royal Institution of Chartered Surveyors, or an
equivalent overseas body. The 31 December 2006 valuation for
a significant majority of the Group’s investment properties was
undertaken by external valuers.
The fair value of investment properties includes £451 million
(2005 – £100 million) of appreciation since purchase.
Rental income from investment properties was £278 million
(2005 – £250 million; 2004 – £241 million). Direct operating
expenses of investment properties were £54 million (2005 –
£61 million; 2004 – £72 million).
Property, plant and equipment, excluding investment properties,
include £607 million (2005 – £84 million) assets in the course of
construction.