RBS 2006 Annual Report Download - page 146
Download and view the complete annual report
Please find page 146 of the 2006 RBS annual report below. You can navigate through the pages in the report by either clicking on the pages listed below, or by using the keyword search tool below to find specific information within the annual report.-
 1
1 -
2
-
3
-
4
-
5
-
6
-
7
-
8
-
9
-
10
-
11
-
12
-
13
-
14
-
15
-
16
-
17
-
18
-
19
-
20
-
21
-
22
-
23
-
24
-
25
-
26
-
27
-
28
-
29
-
30
-
31
-
32
-
33
-
34
-
35
-
36
-
37
-
38
-
39
-
40
-
41
-
42
-
43
-
44
-
45
-
46
-
47
-
48
-
49
-
50
-
51
-
52
-
53
-
54
-
55
-
56
-
57
-
58
-
59
-
60
-
61
-
62
-
63
-
64
-
65
-
66
-
67
-
68
-
69
-
70
-
71
-
72
-
73
-
74
-
75
-
76
-
77
-
78
-
79
-
80
-
81
-
82
-
83
-
84
-
85
-
86
-
87
-
88
-
89
-
90
-
91
-
92
-
93
-
94
-
95
-
96
-
97
-
98
-
99
-
100
-
101
-
102
-
103
-
104
-
105
-
106
-
107
-
108
-
109
-
110
-
111
-
112
-
113
-
114
-
115
-
116
-
117
-
118
-
119
-
120
-
121
-
122
-
123
-
124
-
125
-
126
-
127
-
128
-
129
-
130
-
131
-
132
-
133
-
134
-
135
-
 136
136 -
 137
137 -
 138
138 -
 139
139 -
 140
140 -
 141
141 -
 142
142 -
 143
143 -
 144
144 -
 145
145 -
 146
146 -
 147
147 -
 148
148 -
 149
149 -
 150
150 -
 151
151 -
 152
152 -
 153
153 -
 154
154 -
 155
155 -
 156
156 -
157
-
158
-
159
-
160
-
161
-
162
-
163
-
164
-
165
-
166
-
167
-
168
-
169
-
170
-
171
-
172
-
173
-
174
-
175
-
176
-
177
-
178
-
179
-
180
-
181
-
182
-
183
-
184
-
185
-
186
-
187
-
188
-
189
-
190
-
191
-
192
-
193
-
194
-
195
-
196
-
197
-
198
-
199
-
200
-
201
-
202
-
203
-
204
-
205
-
206
-
207
-
208
-
209
-
210
-
211
-
212
-
213
-
214
-
215
-
216
-
217
-
218
-
219
-
220
-
221
-
222
-
223
-
224
-
225
-
226
-
227
-
228
-
229
-
230
-
231
-
232
-
233
-
234
-
235
-
236
-
237
-
238
-
239
-
240
-
241
-
242
-
243
-
244
-
245
-
246
-
247
-
248
-
249
-
250
-
251
-
252
-
253
-
254
-
255
-
256
-
257
-
258
-
259
-
260
-
261
-
262
 |
 |

145
RBS Group • Annual Report and Accounts 2006
Financial statements
Main scheme All schemes
Present Present
value of value of
Fair value defined Net Fair value defined Net
of plan benefit pension of plan benefit pension
assets obligations liability assets obligations liability
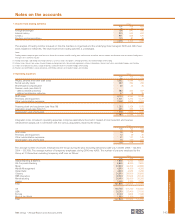
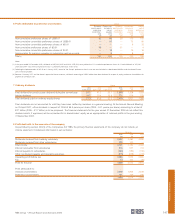
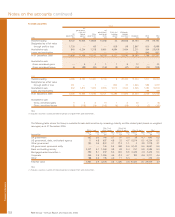
Changes in value of net pension liability £m £m £m £m £m £m
At 1 January 2005 13,569 16,051 2,482 14,798 17,738 2,940
Currency translation and other adjustments — — — 26 26 —
Income statement:
Expected return 930 (930) 1,017 (1,017)
Interest cost 865 865 953 953
Current service cost 447 447 522 522
Past service cost 33 44
930 1,315 385 1,017 1,479 462
Statement of recognised income and expense:
Actuarial gains and losses 1,556 2,273 717 1,660 2,459 799
Disposal of subsidiaries ————(14) (14)
Contributions by employer 380 (380) 452 (452)
Contributions by plan participants —— 4 4
Benefits paid (504) (504) (550) (550)
Expenses included in service cost (17) (17) (19) (19)
At 1 January 2006 15,914 19,118 3,204 17,388 21,123 3,735
Currency translation and other adjustments — — — (59) (65) (6)
Income statement:
Expected return 1,022 (1,022) 1,073 (1,073)
Interest cost 918 918 985 985
Current service cost 571 571 645 645
Past service cost 15 15 23 23
1,022 1,504 482 1,073 1,653 580
Statement of recognised income and expense:
Actuarial gains and losses 552 (1,077) (1,629) 587 (1,194) (1,781)
Contributions by employer 427 — (427) 536 — (536)
Benefits paid (515) (515) — (538) (538) —
Expenses included in service cost (26) (26) — (28) (28) —
At 31 December 2006 17,374 19,004 1,630 18,959 20,951 1,992
The Group expects to contribute £464 million to its defined benefit pension schemes in 2007 (Main scheme – £408 million).
Of the net pension liability, £106 million (2005 – £104 million) relates to unfunded schemes.
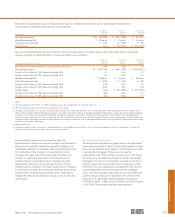
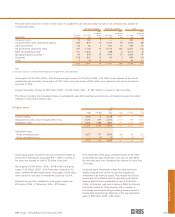
Cumulative net actuarial losses of £619 million (2005 – £2,400 million; 2004 – £1,601 million) have been recognised in the statement
of recognised income and expense, of which £521 million (2005 – £2,150 million; 2004 – £1,433 million) relate to the Main scheme.
Main scheme All schemes
2006 2005 2004 2003 2006 2005 2004 2003
History of defined benefit schemes £m £m £m £m £m £m £m £m
Present value of defined benefit obligations 19,004 19,118 16,051 13,594 20,951 21,123 17,738 14,898
Fair value of plan assets 17,374 15,914 13,569 11,797 18,959 17,388 14,798 12,862
Net deficit 1,630 3,204 2,482 1,797 1,992 3,735 2,940 2,036
Experience losses on plan liabilities (4) (41) (624) (19) (68) (631)
Experience gains on plan assets 552 1,556 392 587 1,660 408
Actual return on pension schemes assets 1,574 2,486 1,230 1,660 2,677 1,328