RBS 2006 Annual Report Download - page 207
Download and view the complete annual report
Please find page 207 of the 2006 RBS annual report below. You can navigate through the pages in the report by either clicking on the pages listed below, or by using the keyword search tool below to find specific information within the annual report.-
 1
1 -
2
-
3
-
4
-
5
-
6
-
7
-
8
-
9
-
10
-
11
-
12
-
13
-
14
-
15
-
16
-
17
-
18
-
19
-
20
-
21
-
22
-
23
-
24
-
25
-
26
-
27
-
28
-
29
-
30
-
31
-
32
-
33
-
34
-
35
-
36
-
37
-
38
-
39
-
40
-
41
-
42
-
43
-
44
-
45
-
46
-
47
-
48
-
49
-
50
-
51
-
52
-
53
-
54
-
55
-
56
-
57
-
58
-
59
-
60
-
61
-
62
-
63
-
64
-
65
-
66
-
67
-
68
-
69
-
70
-
71
-
72
-
73
-
74
-
75
-
76
-
77
-
78
-
79
-
80
-
81
-
82
-
83
-
84
-
85
-
86
-
87
-
88
-
89
-
90
-
91
-
92
-
93
-
94
-
95
-
96
-
97
-
98
-
99
-
100
-
101
-
102
-
103
-
104
-
105
-
106
-
107
-
108
-
109
-
110
-
111
-
112
-
113
-
114
-
115
-
116
-
117
-
118
-
119
-
120
-
121
-
122
-
123
-
124
-
125
-
126
-
127
-
128
-
129
-
130
-
131
-
132
-
133
-
134
-
135
-
136
-
137
-
138
-
139
-
140
-
141
-
142
-
143
-
144
-
145
-
146
-
147
-
148
-
149
-
150
-
151
-
152
-
153
-
154
-
155
-
156
-
157
-
158
-
159
-
160
-
161
-
162
-
163
-
164
-
165
-
166
-
167
-
168
-
169
-
170
-
171
-
172
-
173
-
174
-
175
-
176
-
177
-
178
-
179
-
180
-
181
-
182
-
183
-
184
-
185
-
186
-
187
-
188
-
189
-
190
-
191
-
192
-
193
-
194
-
195
-
196
-
 197
197 -
 198
198 -
 199
199 -
 200
200 -
 201
201 -
 202
202 -
 203
203 -
 204
204 -
 205
205 -
 206
206 -
 207
207 -
 208
208 -
 209
209 -
 210
210 -
 211
211 -
 212
212 -
 213
213 -
 214
214 -
 215
215 -
 216
216 -
 217
217 -
218
-
219
-
220
-
221
-
222
-
223
-
224
-
225
-
226
-
227
-
228
-
229
-
230
-
231
-
232
-
233
-
234
-
235
-
236
-
237
-
238
-
239
-
240
-
241
-
242
-
243
-
244
-
245
-
246
-
247
-
248
-
249
-
250
-
251
-
252
-
253
-
254
-
255
-
256
-
257
-
258
-
259
-
260
-
261
-
262
 |
 |
Financial statements
RBS Group • Annual Report and Accounts 2006
206
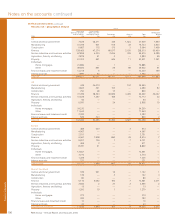
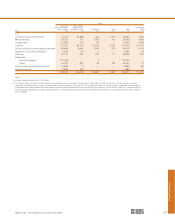
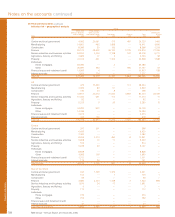
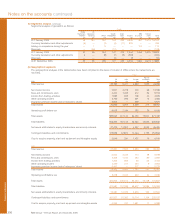
Notes on the accounts continued
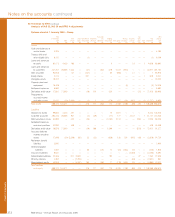
Segmental analysis of goodwill is as follows:
Group
Global UK
Banking & Corporate Wealth Ulster RBS Central
Markets Banking Retail Management Bank Citizens Insurance items Total
£m £m £m £m £m £m £m £m £m
At 1 January 2005 36 150 257 153 425 6,635 961 9,415 18,032
Currency translation and other adjustments (5) — (3) (4) (11) 809 — — 786
Arising on acquisitions during the year — 1 9 — — — 103 — 113
Disposals — (96) — (12) — — — — (108)
At 1 January 2006 31 55 263 137 414 7,444 1,064 9,415 18,823
Currency translation and other adjustments 4 — (8) (7) (9) (904) — — (924)
Disposals — — — (3) — (7) — — (10)
At 31 December 2006 35 55 255 127 405 6,533 1,064 9,415 17,889
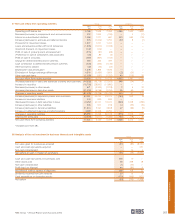
(b) Geographical segments
The geographical analyses in the tables below have been compiled on the basis of location of office where the transactions are
recorded.
Group
Rest of
UK USA Europe the World Total
2006 £m £m £m £m £m
Total revenue 29,162 9,411 4,683 1,030 44,286
Net interest income 7,541 2,278 709 68 10,596
Fees and commissions (net) 3,443 1,245 412 94 5,194
Income from trading activities 1,585 939 108 43 2,675
Other operating income 2,766 295 491 12 3,564
Insurance premium income (net of reinsurers’ share) 5,604 — 369 — 5,973
Total income 20,939 4,757 2,089 217 28,002
Operating profit before tax 6,038 2,334 785 29 9,186
Total assets 589,962 201,134 60,759 19,577 871,432
Total liabilities 568,492 187,143 56,662 13,645 825,942
Net assets attributable to equity shareholders and minority interests 21,470 13,991 4,097 5,932 45,490
Contingent liabilities and commitments 179,558 57,873 13,244 7,159 257,834
Cost to acquire property, plant and equipment and intangible assets 3,040 254 1,427 19 4,740
2005
Total revenue 27,461 7,562 3,650 780 39,453
Net interest income 6,942 2,225 713 38 9,918
Fees and commissions (net) 3,466 1,100 263 80 4,909
Income from trading activities 1,263 959 56 65 2,343
Other operating income 2,330 211 403 9 2,953
Insurance premium income (net of reinsurers’ share) 5,462 — 317 — 5,779
Total income 19,463 4,495 1,752 192 25,902
Operating profit before tax 5,278 2,032 602 24 7,936
Total assets 492,962 205,514 62,203 16,148 776,827
Total liabilities 473,581 191,189 58,527 15,986 739,283
Net assets attributable to equity shareholders and minority interests 19,381 14,325 3,676 162 37,544
Contingent liabilities and commitments 161,927 51,392 10,714 1,164 225,197
Cost to acquire property, plant and equipment and intangible assets 3,353 337 1,581 17 5,288
42 Segmental analysis (continued)