RBS 2006 Annual Report Download - page 239
Download and view the complete annual report
Please find page 239 of the 2006 RBS annual report below. You can navigate through the pages in the report by either clicking on the pages listed below, or by using the keyword search tool below to find specific information within the annual report.-
 1
1 -
2
-
3
-
4
-
5
-
6
-
7
-
8
-
9
-
10
-
11
-
12
-
13
-
14
-
15
-
16
-
17
-
18
-
19
-
20
-
21
-
22
-
23
-
24
-
25
-
26
-
27
-
28
-
29
-
30
-
31
-
32
-
33
-
34
-
35
-
36
-
37
-
38
-
39
-
40
-
41
-
42
-
43
-
44
-
45
-
46
-
47
-
48
-
49
-
50
-
51
-
52
-
53
-
54
-
55
-
56
-
57
-
58
-
59
-
60
-
61
-
62
-
63
-
64
-
65
-
66
-
67
-
68
-
69
-
70
-
71
-
72
-
73
-
74
-
75
-
76
-
77
-
78
-
79
-
80
-
81
-
82
-
83
-
84
-
85
-
86
-
87
-
88
-
89
-
90
-
91
-
92
-
93
-
94
-
95
-
96
-
97
-
98
-
99
-
100
-
101
-
102
-
103
-
104
-
105
-
106
-
107
-
108
-
109
-
110
-
111
-
112
-
113
-
114
-
115
-
116
-
117
-
118
-
119
-
120
-
121
-
122
-
123
-
124
-
125
-
126
-
127
-
128
-
129
-
130
-
131
-
132
-
133
-
134
-
135
-
136
-
137
-
138
-
139
-
140
-
141
-
142
-
143
-
144
-
145
-
146
-
147
-
148
-
149
-
150
-
151
-
152
-
153
-
154
-
155
-
156
-
157
-
158
-
159
-
160
-
161
-
162
-
163
-
164
-
165
-
166
-
167
-
168
-
169
-
170
-
171
-
172
-
173
-
174
-
175
-
176
-
177
-
178
-
179
-
180
-
181
-
182
-
183
-
184
-
185
-
186
-
187
-
188
-
189
-
190
-
191
-
192
-
193
-
194
-
195
-
196
-
197
-
198
-
199
-
200
-
201
-
202
-
203
-
204
-
205
-
206
-
207
-
208
-
209
-
210
-
211
-
212
-
213
-
214
-
215
-
216
-
217
-
218
-
219
-
220
-
221
-
222
-
223
-
224
-
225
-
226
-
227
-
228
-
 229
229 -
 230
230 -
 231
231 -
 232
232 -
 233
233 -
 234
234 -
 235
235 -
 236
236 -
 237
237 -
 238
238 -
 239
239 -
 240
240 -
 241
241 -
 242
242 -
 243
243 -
 244
244 -
 245
245 -
 246
246 -
 247
247 -
 248
248 -
 249
249 -
250
-
251
-
252
-
253
-
254
-
255
-
256
-
257
-
258
-
259
-
260
-
261
-
262
 |
 |

RBS Group • Annual Report and Accounts 2006
238
Additional information continued
Additional information
Amounts in accordance with UK GAAP (continued)
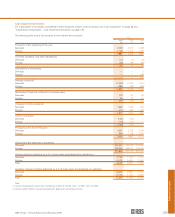
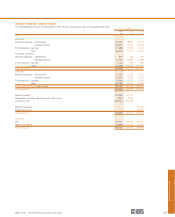
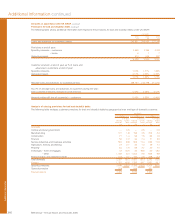
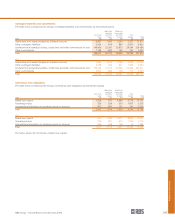
Analysis of loans and advances to customers
The following table analyses loans and advances to customers before provisions by geographical area and type of customer.
UK GAAP
2004 2003 2002
£m £m £m
UK
Central and local government 1,866 1,217 1,521
Manufacturing 6,292 6,384 7,386
Construction 5,024 3,960 3,468
Finance 25,157 18,948 12,396
Service industries and business activities 30,850 29,290 26,022
Agriculture, forestry and fishing 2,480 2,562 2,463
Property 26,445 19,670 15,939
Individuals – home mortgages 57,529 48,117 42,101
Individuals – other 27,863 25,526 22,255
Finance leases and instalment credit 13,083 11,703 11,723
Total domestic 196,589 167,377 145,274
Overseas residents 44,053 27,168 23,657
Total UK offices 240,642 194,545 168,931
Overseas
US 74,045 40,373 41,008
Rest of the World 35,004 21,535 17,305
Total overseas offices 109,049 61,908 58,313
Loans and advances to customers – gross 349,691 256,453 227,244
Provisions for bad and doubtful debts (4,222) (3,922) (3,920)
Loans and advances to customers – net 345,469 252,531 223,324
Fixed rate 100,729 81,918 80,326
Variable rate 248,962 174,535 146,918
Loans and advances to customers – gross 349,691 256,453 227,244
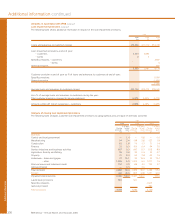
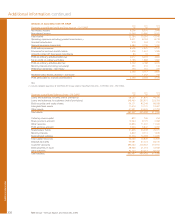
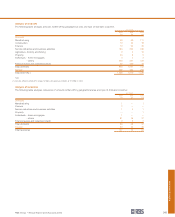
Cross border exposures
The table below sets out the Group’s cross border outstandings in excess of 0.75% of Group total assets (including acceptances),
which totalled £583.8 billion at 31 December 2004 (2003 – £455.0 billion). None of these countries has experienced repayment
difficulties that have required refinancing of outstanding debt.
UK GAAP
2004 2003
£m £m
United States 28,795 14,618
Germany 14,050 15,073
France 9,604 7,524
Netherlands 8,871 6,830
Cayman Islands 7,258 6,666
Spain 5,249 3,421
Japan 4,610 4,141