RBS 2006 Annual Report Download - page 227
Download and view the complete annual report
Please find page 227 of the 2006 RBS annual report below. You can navigate through the pages in the report by either clicking on the pages listed below, or by using the keyword search tool below to find specific information within the annual report.-
 1
1 -
2
-
3
-
4
-
5
-
6
-
7
-
8
-
9
-
10
-
11
-
12
-
13
-
14
-
15
-
16
-
17
-
18
-
19
-
20
-
21
-
22
-
23
-
24
-
25
-
26
-
27
-
28
-
29
-
30
-
31
-
32
-
33
-
34
-
35
-
36
-
37
-
38
-
39
-
40
-
41
-
42
-
43
-
44
-
45
-
46
-
47
-
48
-
49
-
50
-
51
-
52
-
53
-
54
-
55
-
56
-
57
-
58
-
59
-
60
-
61
-
62
-
63
-
64
-
65
-
66
-
67
-
68
-
69
-
70
-
71
-
72
-
73
-
74
-
75
-
76
-
77
-
78
-
79
-
80
-
81
-
82
-
83
-
84
-
85
-
86
-
87
-
88
-
89
-
90
-
91
-
92
-
93
-
94
-
95
-
96
-
97
-
98
-
99
-
100
-
101
-
102
-
103
-
104
-
105
-
106
-
107
-
108
-
109
-
110
-
111
-
112
-
113
-
114
-
115
-
116
-
117
-
118
-
119
-
120
-
121
-
122
-
123
-
124
-
125
-
126
-
127
-
128
-
129
-
130
-
131
-
132
-
133
-
134
-
135
-
136
-
137
-
138
-
139
-
140
-
141
-
142
-
143
-
144
-
145
-
146
-
147
-
148
-
149
-
150
-
151
-
152
-
153
-
154
-
155
-
156
-
157
-
158
-
159
-
160
-
161
-
162
-
163
-
164
-
165
-
166
-
167
-
168
-
169
-
170
-
171
-
172
-
173
-
174
-
175
-
176
-
177
-
178
-
179
-
180
-
181
-
182
-
183
-
184
-
185
-
186
-
187
-
188
-
189
-
190
-
191
-
192
-
193
-
194
-
195
-
196
-
197
-
198
-
199
-
200
-
201
-
202
-
203
-
204
-
205
-
206
-
207
-
208
-
209
-
210
-
211
-
212
-
213
-
214
-
215
-
216
-
 217
217 -
 218
218 -
 219
219 -
 220
220 -
 221
221 -
 222
222 -
 223
223 -
 224
224 -
 225
225 -
 226
226 -
 227
227 -
 228
228 -
 229
229 -
 230
230 -
 231
231 -
 232
232 -
 233
233 -
 234
234 -
 235
235 -
 236
236 -
 237
237 -
238
-
239
-
240
-
241
-
242
-
243
-
244
-
245
-
246
-
247
-
248
-
249
-
250
-
251
-
252
-
253
-
254
-
255
-
256
-
257
-
258
-
259
-
260
-
261
-
262
 |
 |

RBS Group • Annual Report and Accounts 2006
226
Additional information
Additional information
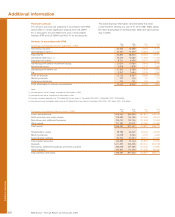
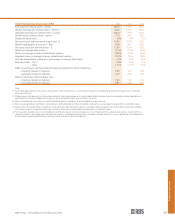
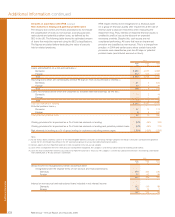
Financial summary
The Group’s accounts are prepared in accordance with IFRS,
which differ in certain significant respects from US GAAP.
For a discussion of such differences and a reconciliation
between IFRS and US GAAP, see Note 47 on the accounts.
The dollar financial information included below has been
converted from sterling at a rate of £1.00 to US$1.9586, being
the Noon Buying Rate on 29 December 2006 (the last business
day in 2006).
Amounts in accordance with IFRS
2006 2006 2005 2004
Summary consolidated income statement – IFRS $m £m £m £m
Net interest income 20,753 10,596 9,918 9,071
Non-interest income (1) 34,091 17,406 15,984 14,320
Total income 54,844 28,002 25,902 23,391
Operating expenses (2,3,4) 24,443 12,480 11,946 10,362
Insurance net claims 8,731 4,458 4,313 4,260
Operating profit before impairment losses 21,670 11,064 9,643 8,769
Impairment losses 3,678 1,878 1,707 1,485
Operating profit before tax 17,992 9,186 7,936 7,284
Tax 5,267 2,689 2,378 1,995
Profit for the year 12,725 6,497 5,558 5,289
Minority interests 204 104 57 177
Preference dividends 374 191 109 256
Profit attributable to ordinary shareholders 12,147 6,202 5,392 4,856
Notes:
(1) Includes gain on sale of strategic investment of £333 million in 2005.
(2) Includes loss on sale of subsidiaries of £93 million in 2005.
(3) Includes integration expenditure of £134 million for the year ended 31 December 2006 (2005 – £458 million; 2004 – £520 million).
(4) Includes purchased intangibles amortisation of £94 million for the year ended 31 December 2006 (2005 – £97 million; 2004 – £45 million).
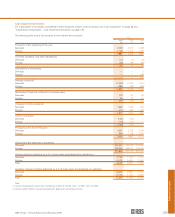
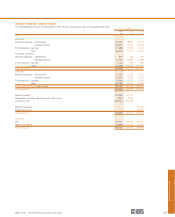
2006 2006 2005 2004
Summary consolidated balance sheet – IFRS $m £m £m £m
Loans and advances 1,076,249 549,499 487,813 408,324
Debt securities and equity shares 275,683 140,755 130,266 98,631
Derivatives and settlement balances 243,074 124,106 101,668 23,482
Other assets 111,781 57,072 57,080 57,685
Total assets 1,706,787 871,432 776,827 588,122
Shareholders’ equity 78,789 40,227 35,435 33,905
Minority interests 10,308 5,263 2,109 3,492
Subordinated liabilities 54,163 27,654 28,274 20,366
Total capital resources 143,260 73,144 65,818 57,763
Deposits 1,011,352 516,365 453,274 383,198
Derivatives, settlement balances and short positions 328,238 167,588 140,426 51,866
Other liabilities 223,937 114,335 117,309 95,295
Total liabilities and equity 1,706,787 871,432 776,827 588,122