RBS 2006 Annual Report Download - page 149
Download and view the complete annual report
Please find page 149 of the 2006 RBS annual report below. You can navigate through the pages in the report by either clicking on the pages listed below, or by using the keyword search tool below to find specific information within the annual report.-
 1
1 -
2
-
3
-
4
-
5
-
6
-
7
-
8
-
9
-
10
-
11
-
12
-
13
-
14
-
15
-
16
-
17
-
18
-
19
-
20
-
21
-
22
-
23
-
24
-
25
-
26
-
27
-
28
-
29
-
30
-
31
-
32
-
33
-
34
-
35
-
36
-
37
-
38
-
39
-
40
-
41
-
42
-
43
-
44
-
45
-
46
-
47
-
48
-
49
-
50
-
51
-
52
-
53
-
54
-
55
-
56
-
57
-
58
-
59
-
60
-
61
-
62
-
63
-
64
-
65
-
66
-
67
-
68
-
69
-
70
-
71
-
72
-
73
-
74
-
75
-
76
-
77
-
78
-
79
-
80
-
81
-
82
-
83
-
84
-
85
-
86
-
87
-
88
-
89
-
90
-
91
-
92
-
93
-
94
-
95
-
96
-
97
-
98
-
99
-
100
-
101
-
102
-
103
-
104
-
105
-
106
-
107
-
108
-
109
-
110
-
111
-
112
-
113
-
114
-
115
-
116
-
117
-
118
-
119
-
120
-
121
-
122
-
123
-
124
-
125
-
126
-
127
-
128
-
129
-
130
-
131
-
132
-
133
-
134
-
135
-
136
-
137
-
138
-
 139
139 -
 140
140 -
 141
141 -
 142
142 -
 143
143 -
 144
144 -
 145
145 -
 146
146 -
 147
147 -
 148
148 -
 149
149 -
 150
150 -
 151
151 -
 152
152 -
 153
153 -
 154
154 -
 155
155 -
 156
156 -
 157
157 -
 158
158 -
 159
159 -
160
-
161
-
162
-
163
-
164
-
165
-
166
-
167
-
168
-
169
-
170
-
171
-
172
-
173
-
174
-
175
-
176
-
177
-
178
-
179
-
180
-
181
-
182
-
183
-
184
-
185
-
186
-
187
-
188
-
189
-
190
-
191
-
192
-
193
-
194
-
195
-
196
-
197
-
198
-
199
-
200
-
201
-
202
-
203
-
204
-
205
-
206
-
207
-
208
-
209
-
210
-
211
-
212
-
213
-
214
-
215
-
216
-
217
-
218
-
219
-
220
-
221
-
222
-
223
-
224
-
225
-
226
-
227
-
228
-
229
-
230
-
231
-
232
-
233
-
234
-
235
-
236
-
237
-
238
-
239
-
240
-
241
-
242
-
243
-
244
-
245
-
246
-
247
-
248
-
249
-
250
-
251
-
252
-
253
-
254
-
255
-
256
-
257
-
258
-
259
-
260
-
261
-
262
 |
 |
RBS Group • Annual Report and Accounts 2006
148
Notes on the accounts continued
Financial statements
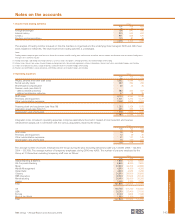
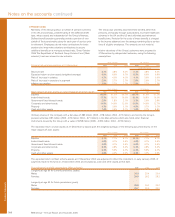
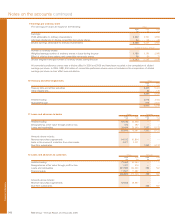
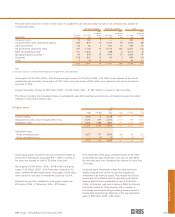
9 Earnings per ordinary share
The earnings per share are based on the following: Group
2006 2005 2004
£m £m £m
Earnings:
Profit attributable to ordinary shareholders 6,202 5,392 4,856
Add back dividends on dilutive convertible non-equity shares 64 65 66
Diluted earnings attributable to ordinary shareholders 6,266 5,457 4,922
Number of shares – millions
Number of ordinary shares:
Weighted average number of ordinary shares in issue during the year 3,185 3,183 3,085
Effect of dilutive share options and convertible non-equity shares 58 60 73
Diluted weighted average number of ordinary shares during the year 3,243 3,243 3,158
All convertible preference shares have a dilutive effect in 2006 and 2005 and have been included in the computation of diluted
earnings per share. In 2004, US$1,500 million of convertible preference shares were not included in the computation of diluted
earnings per share as their effect was anti-dilutive.
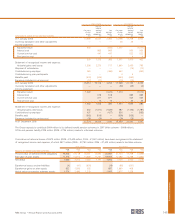
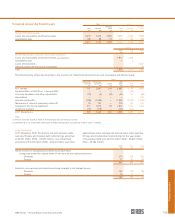
10 Treasury and other eligible bills Group
2006 2005
£m £m
Treasury bills and similar securities 5,407 5,402
Other eligible bills 84 136
5,491 5,538
Held-for-trading 4,516 3,004
Available-for-sale 975 2,534
5,491 5,538
11 Loans and advances to banks Group Company
2006 2005 2006 2005
£m £m £m £m
Held-for-trading 52,736 44,965 ——
Designated as at fair value through profit or loss 376 282 ——
Loans and receivables 29,494 25,340 7,252 9,122
82,606 70,587 7,252 9,122
Amounts above include:
Reverse repurchase agreements 54,152 41,804 ——
Items in the course of collection from other banks 3,471 2,901
Due from subsidiaries 7,252 9,122
12 Loans and advances to customers Group Company
2006 2005 2006 2005
£m £m £m £m
Held-for-trading 72,462 53,963 ——
Designated as at fair value through profit or loss 1,327 616 ——
Loans and receivables 381,583 350,960 286 567
Finance leases 11,521 11,687 ——
466,893 417,226 286 567
Amounts above include:
Reverse repurchase agreements 62,908 48,887 ——
Due from subsidiaries 286 567