RBS 2006 Annual Report Download - page 69
Download and view the complete annual report
Please find page 69 of the 2006 RBS annual report below. You can navigate through the pages in the report by either clicking on the pages listed below, or by using the keyword search tool below to find specific information within the annual report.-
 1
1 -
2
-
3
-
4
-
5
-
6
-
7
-
8
-
9
-
10
-
11
-
12
-
13
-
14
-
15
-
16
-
17
-
18
-
19
-
20
-
21
-
22
-
23
-
24
-
25
-
26
-
27
-
28
-
29
-
30
-
31
-
32
-
33
-
34
-
35
-
36
-
37
-
38
-
39
-
40
-
41
-
42
-
43
-
44
-
45
-
46
-
47
-
48
-
49
-
50
-
51
-
52
-
53
-
54
-
55
-
56
-
57
-
58
-
 59
59 -
 60
60 -
 61
61 -
 62
62 -
 63
63 -
 64
64 -
 65
65 -
 66
66 -
 67
67 -
 68
68 -
 69
69 -
 70
70 -
 71
71 -
 72
72 -
 73
73 -
 74
74 -
 75
75 -
 76
76 -
 77
77 -
 78
78 -
 79
79 -
80
-
81
-
82
-
83
-
84
-
85
-
86
-
87
-
88
-
89
-
90
-
91
-
92
-
93
-
94
-
95
-
96
-
97
-
98
-
99
-
100
-
101
-
102
-
103
-
104
-
105
-
106
-
107
-
108
-
109
-
110
-
111
-
112
-
113
-
114
-
115
-
116
-
117
-
118
-
119
-
120
-
121
-
122
-
123
-
124
-
125
-
126
-
127
-
128
-
129
-
130
-
131
-
132
-
133
-
134
-
135
-
136
-
137
-
138
-
139
-
140
-
141
-
142
-
143
-
144
-
145
-
146
-
147
-
148
-
149
-
150
-
151
-
152
-
153
-
154
-
155
-
156
-
157
-
158
-
159
-
160
-
161
-
162
-
163
-
164
-
165
-
166
-
167
-
168
-
169
-
170
-
171
-
172
-
173
-
174
-
175
-
176
-
177
-
178
-
179
-
180
-
181
-
182
-
183
-
184
-
185
-
186
-
187
-
188
-
189
-
190
-
191
-
192
-
193
-
194
-
195
-
196
-
197
-
198
-
199
-
200
-
201
-
202
-
203
-
204
-
205
-
206
-
207
-
208
-
209
-
210
-
211
-
212
-
213
-
214
-
215
-
216
-
217
-
218
-
219
-
220
-
221
-
222
-
223
-
224
-
225
-
226
-
227
-
228
-
229
-
230
-
231
-
232
-
233
-
234
-
235
-
236
-
237
-
238
-
239
-
240
-
241
-
242
-
243
-
244
-
245
-
246
-
247
-
248
-
249
-
250
-
251
-
252
-
253
-
254
-
255
-
256
-
257
-
258
-
259
-
260
-
261
-
262
 |
 |

RBS Group • Annual Report and Accounts 2006
68
Operating and financial review continued
Operating and financial review
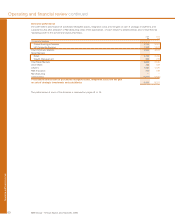
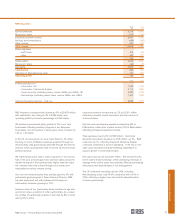
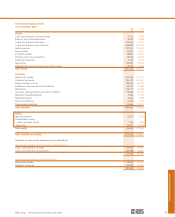
Wealth Management
2006 2005
£m £m
Net interest income 500 442
Non-interest income 434 372
Total income 934 814
Direct expenses
– staff costs 299 258
– other 137 133
436 391
Contribution before impairment losses 498 423
Impairment losses 1 13
Contribution 497 410
Allocation of Manufacturing costs 143 138
Operating profit 354 272
Loans and advances to customers – gross 8.8 7.8
Investment management assets – excluding deposits 28.2 25.4
Customer deposits 28.5 25.5
Risk-weighted assets 6.5 6.1
Wealth Management delivered strong growth, with total income
rising by 15% to £934 million. Contribution grew by 21% to
£497 million and operating profit by 30% to £354 million.
Wealth Management’s offering of private banking and
investment services delivered robust organic income growth in
2006. Our continuing investment in Coutts UK, Adam &
Company and our offshore businesses helped us to achieve an
overall increase in client numbers of 5%. Coutts UK
customers rose by 9%. Outside the UK, Coutts International
moved its headquarters to Singapore and was successful in
the Asia-Pacific region in recruiting additional experienced
private bankers. We grew customer numbers in the region by
13% and income by 24%.
Growth in banking volumes contributed to a 13% rise in net
interest income to £500 million. Average loans and advances
to customers rose by 14% and average deposits by 10%, with
net interest margin maintained at close to 2005 levels.
Non-interest income grew by 17% to £434 million, reflecting
higher investment management fees and performance fees, as
well as strong growth in new business volumes, particularly in
the UK. Assets under management rose by 11%, to £28.2 billion
at the year-end.
Total expenses rose by 9% to £579 million. In a highly
competitive recruitment market, headcount was successfully
increased by 7%, reflecting our continued investment in the UK
and further expansion in Asia.
Impairment losses returned to historic levels, following a
number of specific items in prior years.