RBS 2006 Annual Report Download - page 154
Download and view the complete annual report
Please find page 154 of the 2006 RBS annual report below. You can navigate through the pages in the report by either clicking on the pages listed below, or by using the keyword search tool below to find specific information within the annual report.-
 1
1 -
2
-
3
-
4
-
5
-
6
-
7
-
8
-
9
-
10
-
11
-
12
-
13
-
14
-
15
-
16
-
17
-
18
-
19
-
20
-
21
-
22
-
23
-
24
-
25
-
26
-
27
-
28
-
29
-
30
-
31
-
32
-
33
-
34
-
35
-
36
-
37
-
38
-
39
-
40
-
41
-
42
-
43
-
44
-
45
-
46
-
47
-
48
-
49
-
50
-
51
-
52
-
53
-
54
-
55
-
56
-
57
-
58
-
59
-
60
-
61
-
62
-
63
-
64
-
65
-
66
-
67
-
68
-
69
-
70
-
71
-
72
-
73
-
74
-
75
-
76
-
77
-
78
-
79
-
80
-
81
-
82
-
83
-
84
-
85
-
86
-
87
-
88
-
89
-
90
-
91
-
92
-
93
-
94
-
95
-
96
-
97
-
98
-
99
-
100
-
101
-
102
-
103
-
104
-
105
-
106
-
107
-
108
-
109
-
110
-
111
-
112
-
113
-
114
-
115
-
116
-
117
-
118
-
119
-
120
-
121
-
122
-
123
-
124
-
125
-
126
-
127
-
128
-
129
-
130
-
131
-
132
-
133
-
134
-
135
-
136
-
137
-
138
-
139
-
140
-
141
-
142
-
143
-
 144
144 -
 145
145 -
 146
146 -
 147
147 -
 148
148 -
 149
149 -
 150
150 -
 151
151 -
 152
152 -
 153
153 -
 154
154 -
 155
155 -
 156
156 -
 157
157 -
 158
158 -
 159
159 -
 160
160 -
 161
161 -
 162
162 -
 163
163 -
 164
164 -
165
-
166
-
167
-
168
-
169
-
170
-
171
-
172
-
173
-
174
-
175
-
176
-
177
-
178
-
179
-
180
-
181
-
182
-
183
-
184
-
185
-
186
-
187
-
188
-
189
-
190
-
191
-
192
-
193
-
194
-
195
-
196
-
197
-
198
-
199
-
200
-
201
-
202
-
203
-
204
-
205
-
206
-
207
-
208
-
209
-
210
-
211
-
212
-
213
-
214
-
215
-
216
-
217
-
218
-
219
-
220
-
221
-
222
-
223
-
224
-
225
-
226
-
227
-
228
-
229
-
230
-
231
-
232
-
233
-
234
-
235
-
236
-
237
-
238
-
239
-
240
-
241
-
242
-
243
-
244
-
245
-
246
-
247
-
248
-
249
-
250
-
251
-
252
-
253
-
254
-
255
-
256
-
257
-
258
-
259
-
260
-
261
-
262
 |
 |

153
RBS Group • Annual Report and Accounts 2006
Financial statements
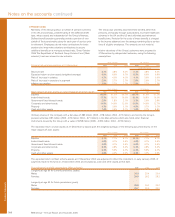
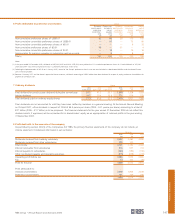
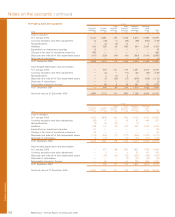
The table below shows the number and fair value of available-for-sale debt securities that were in an unrealised loss position at
31 December 2006.
Less than 12 months More than 12 months Total
Gross Gross Gross
unrealised unrealised unrealised
Number Fair value losses Fair value losses Fair value losses
Issued by of issues £m £m £m £m £m £m
UK government 19 263 5 — — 263 5
US government, state, and federal agency 249 829 10 4,215 78 5,044 88
Other government 42 63 3 633 17 696 20
US government sponsored entity 277 1,102 17 5,149 125 6,251 142
Bank and building society 101 2,245 3 268 5 2,513 8
Mortgage-backed securities (1) 60 624 14 1,440 33 2,064 47
Corporate 278 827 14 62 2 889 16
Other 7 44 13 — — 44 13
1,033 5,997 79 11,767 260 17,764 339
Note:
(1) Excludes securities issued by US federal agencies and government sponsored entities.
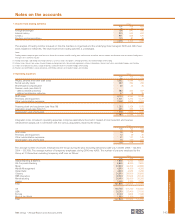
Gross gains of £34 million (2005 – £65 million) and gross losses of £19 million (2005 – £12 million) were realised on the sale of
available-for-sale securities. Gross gains of £197 million and gross losses of £30 million were realised on the sale of investment
securities in 2004.
Interest receivable includes £1,559 million (2005 – £1,624 million; 2004 – £1,487 million) in respect of debt securities.
The Group considers that unrealised losses on available-for-sale debt securities are temporary, principally because they reflect
changes in benchmark interest rates.
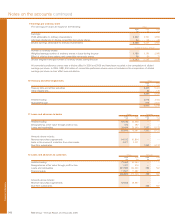
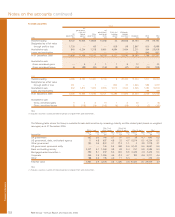
14 Equity shares Group
2006 2005
Listed Unlisted Total Listed Unlisted Total
£m £m £m £m £m £m
Held-for-trading 3,033 5 3,038 2,937 4 2,941
Designated as at fair value through profit or loss 2,051 559 2,610 2,113 428 2,541
Available-for-sale 6,367 1,489 7,856 704 3,115 3,819
11,451 2,053 13,504 5,754 3,547 9,301
Available-for-sale
Gross unrealised gains 4,377 177 4,554 168 54 222
Gross unrealised losses — (6) (6) (5) (8) (13)
4,377 171 4,548 163 46 209
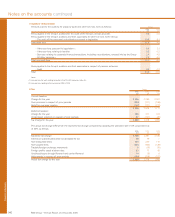
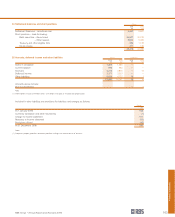
Listed equity shares include the Group’s investment in Bank of
China which, following its successful IPO in 2006, is carried at
fair value and showed an uplift of £4 billion in the year.
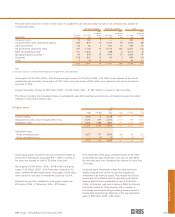
Gross gains of £357 million (2005 – £618 million) and gross
losses of £3 million (2005 – £4 million) were realised on the
sale of available-for-sale equity shares. Gross gains of £96 million
were realised on the sale of investment securities in 2004.
Dividend income from available-for-sale equity shares was
£92 million (2005 – £108 million; 2004 – £79 million).
At 31 December 2006, gross unrealised losses of £6 million
represented 22 equity issues with a fair value of £26 million.
No securities were in an unrealised loss position for more than
12 months.
Unquoted equity investments whose fair value cannot be
reliably measured are carried at cost and classified as
available-for-sale financial assets. They include the Group’s
investments in the Federal Home Loans Bank and Federal
Reserve Bank that are redeemable at cost of £0.8 billion
(2005 – £0.8 billion), and prior to listing in 2006, the Group’s
investment in Bank of China, together with a number of
individually small shareholdings including those received in
trouble debt restructurings. Disposals in the year generated
gains of £56 million (2005 – £85 million).