RBS 2006 Annual Report Download - page 223
Download and view the complete annual report
Please find page 223 of the 2006 RBS annual report below. You can navigate through the pages in the report by either clicking on the pages listed below, or by using the keyword search tool below to find specific information within the annual report.-
 1
1 -
2
-
3
-
4
-
5
-
6
-
7
-
8
-
9
-
10
-
11
-
12
-
13
-
14
-
15
-
16
-
17
-
18
-
19
-
20
-
21
-
22
-
23
-
24
-
25
-
26
-
27
-
28
-
29
-
30
-
31
-
32
-
33
-
34
-
35
-
36
-
37
-
38
-
39
-
40
-
41
-
42
-
43
-
44
-
45
-
46
-
47
-
48
-
49
-
50
-
51
-
52
-
53
-
54
-
55
-
56
-
57
-
58
-
59
-
60
-
61
-
62
-
63
-
64
-
65
-
66
-
67
-
68
-
69
-
70
-
71
-
72
-
73
-
74
-
75
-
76
-
77
-
78
-
79
-
80
-
81
-
82
-
83
-
84
-
85
-
86
-
87
-
88
-
89
-
90
-
91
-
92
-
93
-
94
-
95
-
96
-
97
-
98
-
99
-
100
-
101
-
102
-
103
-
104
-
105
-
106
-
107
-
108
-
109
-
110
-
111
-
112
-
113
-
114
-
115
-
116
-
117
-
118
-
119
-
120
-
121
-
122
-
123
-
124
-
125
-
126
-
127
-
128
-
129
-
130
-
131
-
132
-
133
-
134
-
135
-
136
-
137
-
138
-
139
-
140
-
141
-
142
-
143
-
144
-
145
-
146
-
147
-
148
-
149
-
150
-
151
-
152
-
153
-
154
-
155
-
156
-
157
-
158
-
159
-
160
-
161
-
162
-
163
-
164
-
165
-
166
-
167
-
168
-
169
-
170
-
171
-
172
-
173
-
174
-
175
-
176
-
177
-
178
-
179
-
180
-
181
-
182
-
183
-
184
-
185
-
186
-
187
-
188
-
189
-
190
-
191
-
192
-
193
-
194
-
195
-
196
-
197
-
198
-
199
-
200
-
201
-
202
-
203
-
204
-
205
-
206
-
207
-
208
-
209
-
210
-
211
-
212
-
 213
213 -
 214
214 -
 215
215 -
 216
216 -
 217
217 -
 218
218 -
 219
219 -
 220
220 -
 221
221 -
 222
222 -
 223
223 -
 224
224 -
 225
225 -
 226
226 -
 227
227 -
 228
228 -
 229
229 -
 230
230 -
 231
231 -
 232
232 -
 233
233 -
234
-
235
-
236
-
237
-
238
-
239
-
240
-
241
-
242
-
243
-
244
-
245
-
246
-
247
-
248
-
249
-
250
-
251
-
252
-
253
-
254
-
255
-
256
-
257
-
258
-
259
-
260
-
261
-
262
 |
 |

Financial statements
RBS Group • Annual Report and Accounts 2006
222
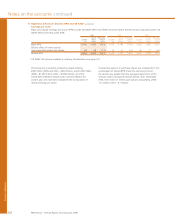
Notes on the accounts continued
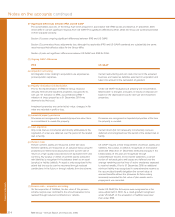
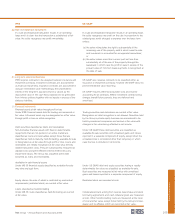
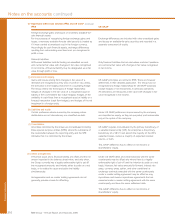
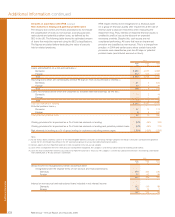
47 Significant differences between IFRS and US GAAP (continued)
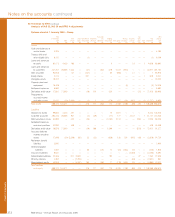
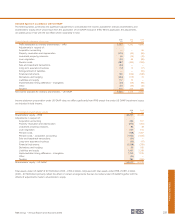
Earnings per share
Basic and diluted earnings per share (“EPS”) under US GAAP differ from IFRS only to the extent that the income calculated under US
GAAP differs from that under IFRS.
2006 2005 2004
No. of Per share No. of Per share No. of Per share
Income* shares amount Income* shares amount Income* shares amount
£m million pence £m million pence £m million pence
Basic EPS 5,440 3,185 170.8 4,475 3,183 140.6 3,909 3,085 126.7
Dilutive effect of share options
and convertible preference shares 64 58 (1.1) 65 60 (0.6) 66 73 (0.8)
Diluted EPS 5,504 3,243 169.7 4,540 3,243 140.0 3,975 3,158 125.9
* US GAAP net income available to ordinary shareholders, see page 221.
The Group has convertible preference shares totalling
£200 million (2005 and 2004 – £200 million), and $1,000 million
(2005 – $1,000 million; 2004 – $1,900 million). All of the
convertible preference shares have a dilutive effect in the
current year and have been included in the computation of
diluted earnings per share.
Outstanding options to purchase shares are excluded from the
computation of diluted EPS where the exercise prices of
the options are greater than the average market price of the
ordinary shares during the relevant period. At 31 December
2006, there were 5.1 million such options outstanding (2005 –
17.3 million; 2004 – 8.7 million).