RBS 2006 Annual Report Download - page 208
Download and view the complete annual report
Please find page 208 of the 2006 RBS annual report below. You can navigate through the pages in the report by either clicking on the pages listed below, or by using the keyword search tool below to find specific information within the annual report.-
 1
1 -
2
-
3
-
4
-
5
-
6
-
7
-
8
-
9
-
10
-
11
-
12
-
13
-
14
-
15
-
16
-
17
-
18
-
19
-
20
-
21
-
22
-
23
-
24
-
25
-
26
-
27
-
28
-
29
-
30
-
31
-
32
-
33
-
34
-
35
-
36
-
37
-
38
-
39
-
40
-
41
-
42
-
43
-
44
-
45
-
46
-
47
-
48
-
49
-
50
-
51
-
52
-
53
-
54
-
55
-
56
-
57
-
58
-
59
-
60
-
61
-
62
-
63
-
64
-
65
-
66
-
67
-
68
-
69
-
70
-
71
-
72
-
73
-
74
-
75
-
76
-
77
-
78
-
79
-
80
-
81
-
82
-
83
-
84
-
85
-
86
-
87
-
88
-
89
-
90
-
91
-
92
-
93
-
94
-
95
-
96
-
97
-
98
-
99
-
100
-
101
-
102
-
103
-
104
-
105
-
106
-
107
-
108
-
109
-
110
-
111
-
112
-
113
-
114
-
115
-
116
-
117
-
118
-
119
-
120
-
121
-
122
-
123
-
124
-
125
-
126
-
127
-
128
-
129
-
130
-
131
-
132
-
133
-
134
-
135
-
136
-
137
-
138
-
139
-
140
-
141
-
142
-
143
-
144
-
145
-
146
-
147
-
148
-
149
-
150
-
151
-
152
-
153
-
154
-
155
-
156
-
157
-
158
-
159
-
160
-
161
-
162
-
163
-
164
-
165
-
166
-
167
-
168
-
169
-
170
-
171
-
172
-
173
-
174
-
175
-
176
-
177
-
178
-
179
-
180
-
181
-
182
-
183
-
184
-
185
-
186
-
187
-
188
-
189
-
190
-
191
-
192
-
193
-
194
-
195
-
196
-
197
-
 198
198 -
 199
199 -
 200
200 -
 201
201 -
 202
202 -
 203
203 -
 204
204 -
 205
205 -
 206
206 -
 207
207 -
 208
208 -
 209
209 -
 210
210 -
 211
211 -
 212
212 -
 213
213 -
 214
214 -
 215
215 -
 216
216 -
 217
217 -
 218
218 -
219
-
220
-
221
-
222
-
223
-
224
-
225
-
226
-
227
-
228
-
229
-
230
-
231
-
232
-
233
-
234
-
235
-
236
-
237
-
238
-
239
-
240
-
241
-
242
-
243
-
244
-
245
-
246
-
247
-
248
-
249
-
250
-
251
-
252
-
253
-
254
-
255
-
256
-
257
-
258
-
259
-
260
-
261
-
262
 |
 |
RBS Group • Annual Report and Accounts 2006 207
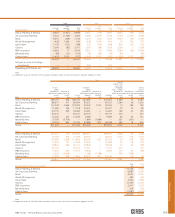
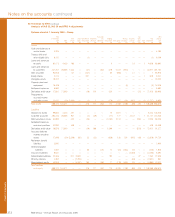
Financial statements
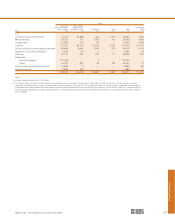
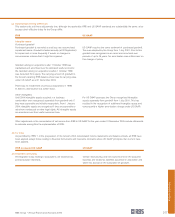
Group
Rest of
UK USA Europe the World Total
2004 £m £m £m £m £m
Total revenue 25,486 4,698 2,772 421 33,377
Net interest income 6,454 1,825 751 41 9,071
Fees and commissions (net) 3,455 717 301 74 4,547
Income from trading activities 1,113 821 18 36 1,988
Other operating income 1,741 109 284 4 2,138
Insurance premium income (net of reinsurers’ share) 5,390 — 257 — 5,647
Total income 18,153 3,472 1,611 155 23,391
Operating profit before tax 5,059 1,575 583 67 7,284
Total assets 382,623 145,748 45,845 13,906 588,122
Total liabilities 362,297 131,449 43,129 13,850 550,725
Net assets attributable to equity shareholders and minority interests 20,326 14,299 2,716 56 37,397
Contingent liabilities and commitments 151,489 37,972 6,791 618 196,870
Cost to acquire property, plant and equipment and intangible assets 3,811 6,178 1,736 2 11,727
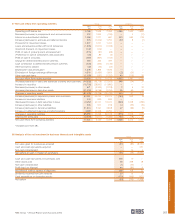
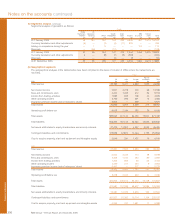
43 Directors’ and key management remuneration Group
2006 2005
Directors’ remuneration £000 £000
Non-executive directors – emoluments 998 924
Chairman and executive directors – emoluments 19,448 8,994
Chairman and executive directors – contributions and allowances in respect of defined
contribution pension schemes 101 220
20,547 10,138
Chairman and executive directors – amounts receivable under long-term incentive plans 3,997 4,778
Chairman and executive directors – gains on exercise of share options 2 11
24,546 14,927
The figures for 2006 include remuneration paid to Mr Cameron and Mr Fisher prior to their appointment as directors on 1 March 2006.
For this period, Mr Cameron and Mr Fisher received salary and benefits of £141,000 and £105,000 respectively. The figures above
also include the full year performance bonus for Mr Cameron and Mr Fisher.
Retirement benefits are accruing to five directors (2005 – four) under defined benefit schemes, two (2005 – two) of whom also
accrued benefits under defined contribution schemes.
The executive directors may also participate in the company’s executive share option, sharesave and option 2000 schemes and
details of their interests in the company’s shares arising from their participation are given on pages 120 and 121. Details of the
remuneration received by each director during the year and each director’s pension arrangements are given on pages 119 to 124.
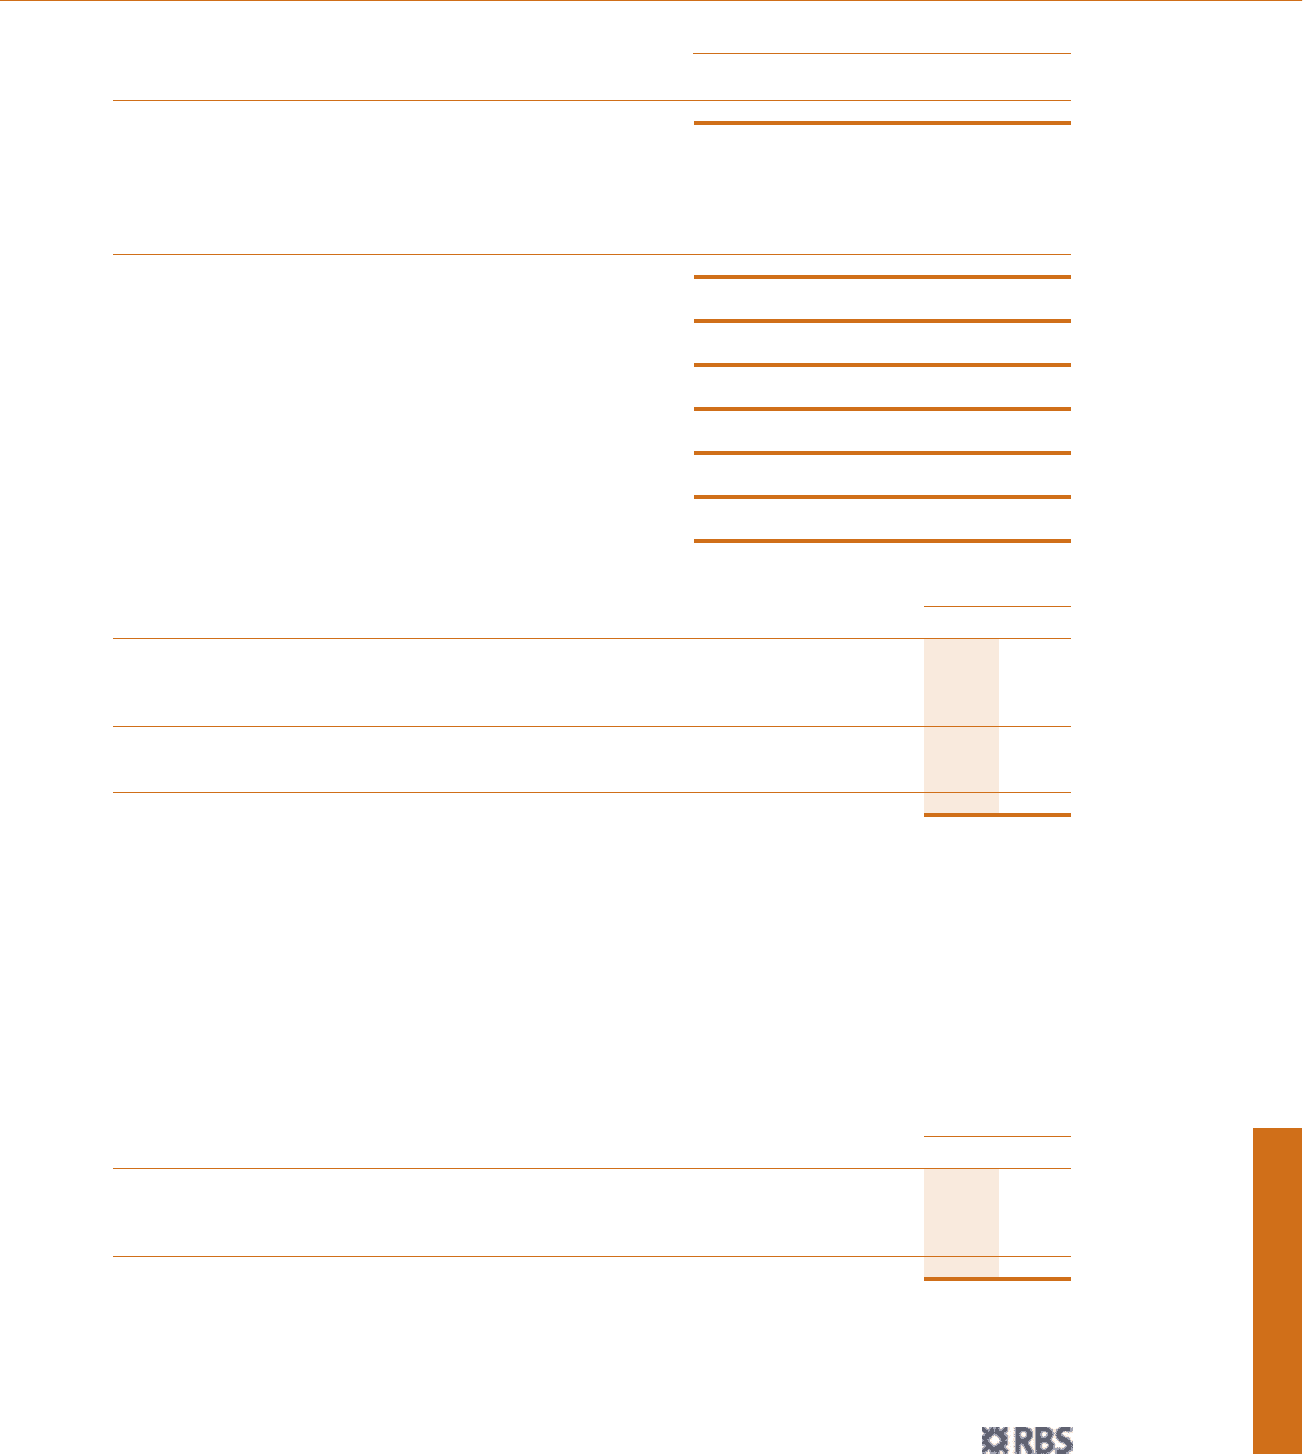
Compensation of key management
The aggregate remuneration of directors and other members of key management during the year was as follows:
Group
2006 2005
£000 £000
Short-term benefits 41,003 26,180
Post-employment benefits 11,264 9,383
Other long-term 3,309 4,215
Share-based payments 2,787 1,568
58,363 41,346