RBS 2006 Annual Report Download - page 142
Download and view the complete annual report
Please find page 142 of the 2006 RBS annual report below. You can navigate through the pages in the report by either clicking on the pages listed below, or by using the keyword search tool below to find specific information within the annual report.-
 1
1 -
2
-
3
-
4
-
5
-
6
-
7
-
8
-
9
-
10
-
11
-
12
-
13
-
14
-
15
-
16
-
17
-
18
-
19
-
20
-
21
-
22
-
23
-
24
-
25
-
26
-
27
-
28
-
29
-
30
-
31
-
32
-
33
-
34
-
35
-
36
-
37
-
38
-
39
-
40
-
41
-
42
-
43
-
44
-
45
-
46
-
47
-
48
-
49
-
50
-
51
-
52
-
53
-
54
-
55
-
56
-
57
-
58
-
59
-
60
-
61
-
62
-
63
-
64
-
65
-
66
-
67
-
68
-
69
-
70
-
71
-
72
-
73
-
74
-
75
-
76
-
77
-
78
-
79
-
80
-
81
-
82
-
83
-
84
-
85
-
86
-
87
-
88
-
89
-
90
-
91
-
92
-
93
-
94
-
95
-
96
-
97
-
98
-
99
-
100
-
101
-
102
-
103
-
104
-
105
-
106
-
107
-
108
-
109
-
110
-
111
-
112
-
113
-
114
-
115
-
116
-
117
-
118
-
119
-
120
-
121
-
122
-
123
-
124
-
125
-
126
-
127
-
128
-
129
-
130
-
131
-
 132
132 -
 133
133 -
 134
134 -
 135
135 -
 136
136 -
 137
137 -
 138
138 -
 139
139 -
 140
140 -
 141
141 -
 142
142 -
 143
143 -
 144
144 -
 145
145 -
 146
146 -
 147
147 -
 148
148 -
 149
149 -
 150
150 -
 151
151 -
 152
152 -
153
-
154
-
155
-
156
-
157
-
158
-
159
-
160
-
161
-
162
-
163
-
164
-
165
-
166
-
167
-
168
-
169
-
170
-
171
-
172
-
173
-
174
-
175
-
176
-
177
-
178
-
179
-
180
-
181
-
182
-
183
-
184
-
185
-
186
-
187
-
188
-
189
-
190
-
191
-
192
-
193
-
194
-
195
-
196
-
197
-
198
-
199
-
200
-
201
-
202
-
203
-
204
-
205
-
206
-
207
-
208
-
209
-
210
-
211
-
212
-
213
-
214
-
215
-
216
-
217
-
218
-
219
-
220
-
221
-
222
-
223
-
224
-
225
-
226
-
227
-
228
-
229
-
230
-
231
-
232
-
233
-
234
-
235
-
236
-
237
-
238
-
239
-
240
-
241
-
242
-
243
-
244
-
245
-
246
-
247
-
248
-
249
-
250
-
251
-
252
-
253
-
254
-
255
-
256
-
257
-
258
-
259
-
260
-
261
-
262
 |
 |
141
RBS Group • Annual Report and Accounts 2006
Financial statements
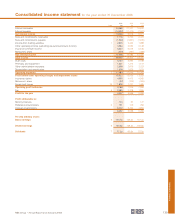
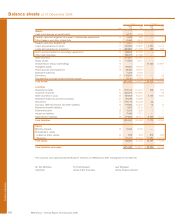
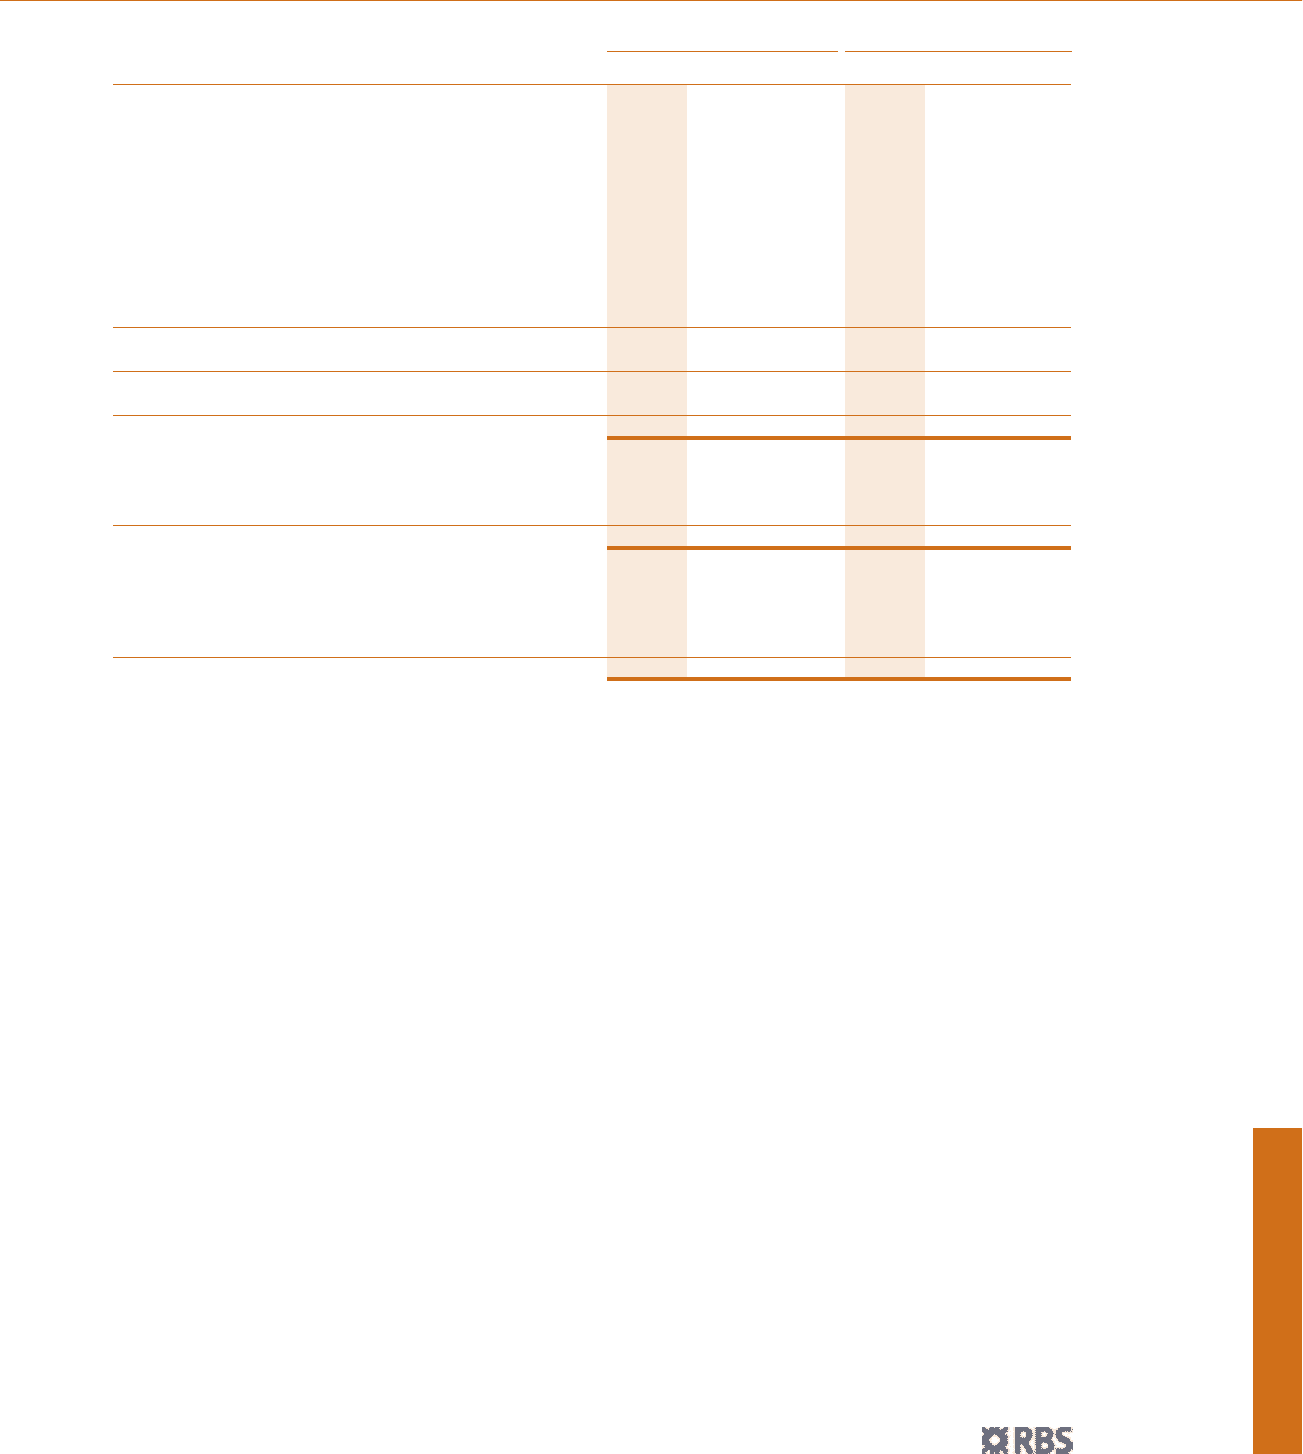
Statements of recognised income and expense for the year ended 31 December 2006
Group Company
2006 2005 2004 2006 2005 2004
£m £m £m £m £m £m
Available-for-sale investments
Net valuation gains taken direct to equity 4,792 35 ——
Net profit taken to income on sales (313) (582) ——
Cash flow hedges
Net (losses)/gains taken direct to equity (109) 18 ——
Net (gains)/losses taken to earnings (140) (85) 36
Exchange differences on translation of foreign operations (1,681) 842 (606) —— —
Actuarial gains/(losses) on defined benefit plans 1,781 (799) (1,601) ———
Other movements — ————(1)
Income/(expense) before tax on items recognised direct in equity 4,330 (571) (2,207) 36(1)
Tax on items recognised direct in equity (1,173) 478 465 (1) (2) —
Net income/(expense) recognised direct in equity 3,157 (93) (1,742) 24(1)
Profit for the year 6,497 5,558 5,289 3,499 2,074 2,874
Total recognised income and expense for the year 9,654 5,465 3,547 3,501 2,078 2,873
Attributable to:
Equity shareholders 7,707 5,355 3,558 3,501 2,078 2,873
Minority interests 1,947 110 (11) ———
9,654 5,465 3,547 3,501 2,078 2,873
Effect of changes in accounting policies
on implementation of IFRS
Equity shareholders — (1,843) 1,243 —(16,759) (15,798)
Minority interests — (2,878) (321) ———
—(4,721) 922 —(16,759) (15,798)