RBS 2006 Annual Report Download - page 85
Download and view the complete annual report
Please find page 85 of the 2006 RBS annual report below. You can navigate through the pages in the report by either clicking on the pages listed below, or by using the keyword search tool below to find specific information within the annual report.-
 1
1 -
2
-
3
-
4
-
5
-
6
-
7
-
8
-
9
-
10
-
11
-
12
-
13
-
14
-
15
-
16
-
17
-
18
-
19
-
20
-
21
-
22
-
23
-
24
-
25
-
26
-
27
-
28
-
29
-
30
-
31
-
32
-
33
-
34
-
35
-
36
-
37
-
38
-
39
-
40
-
41
-
42
-
43
-
44
-
45
-
46
-
47
-
48
-
49
-
50
-
51
-
52
-
53
-
54
-
55
-
56
-
57
-
58
-
59
-
60
-
61
-
62
-
63
-
64
-
65
-
66
-
67
-
68
-
69
-
70
-
71
-
72
-
73
-
74
-
 75
75 -
 76
76 -
 77
77 -
 78
78 -
 79
79 -
 80
80 -
 81
81 -
 82
82 -
 83
83 -
 84
84 -
 85
85 -
 86
86 -
 87
87 -
 88
88 -
 89
89 -
 90
90 -
 91
91 -
 92
92 -
 93
93 -
 94
94 -
 95
95 -
96
-
97
-
98
-
99
-
100
-
101
-
102
-
103
-
104
-
105
-
106
-
107
-
108
-
109
-
110
-
111
-
112
-
113
-
114
-
115
-
116
-
117
-
118
-
119
-
120
-
121
-
122
-
123
-
124
-
125
-
126
-
127
-
128
-
129
-
130
-
131
-
132
-
133
-
134
-
135
-
136
-
137
-
138
-
139
-
140
-
141
-
142
-
143
-
144
-
145
-
146
-
147
-
148
-
149
-
150
-
151
-
152
-
153
-
154
-
155
-
156
-
157
-
158
-
159
-
160
-
161
-
162
-
163
-
164
-
165
-
166
-
167
-
168
-
169
-
170
-
171
-
172
-
173
-
174
-
175
-
176
-
177
-
178
-
179
-
180
-
181
-
182
-
183
-
184
-
185
-
186
-
187
-
188
-
189
-
190
-
191
-
192
-
193
-
194
-
195
-
196
-
197
-
198
-
199
-
200
-
201
-
202
-
203
-
204
-
205
-
206
-
207
-
208
-
209
-
210
-
211
-
212
-
213
-
214
-
215
-
216
-
217
-
218
-
219
-
220
-
221
-
222
-
223
-
224
-
225
-
226
-
227
-
228
-
229
-
230
-
231
-
232
-
233
-
234
-
235
-
236
-
237
-
238
-
239
-
240
-
241
-
242
-
243
-
244
-
245
-
246
-
247
-
248
-
249
-
250
-
251
-
252
-
253
-
254
-
255
-
256
-
257
-
258
-
259
-
260
-
261
-
262
 |
 |
RBS Group • Annual Report and Accounts 2006
84
Operating and financial review continued
Operating and financial review
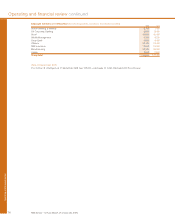
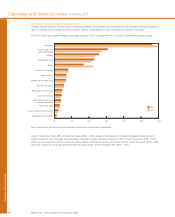
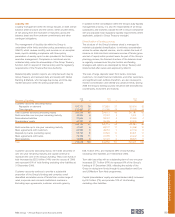
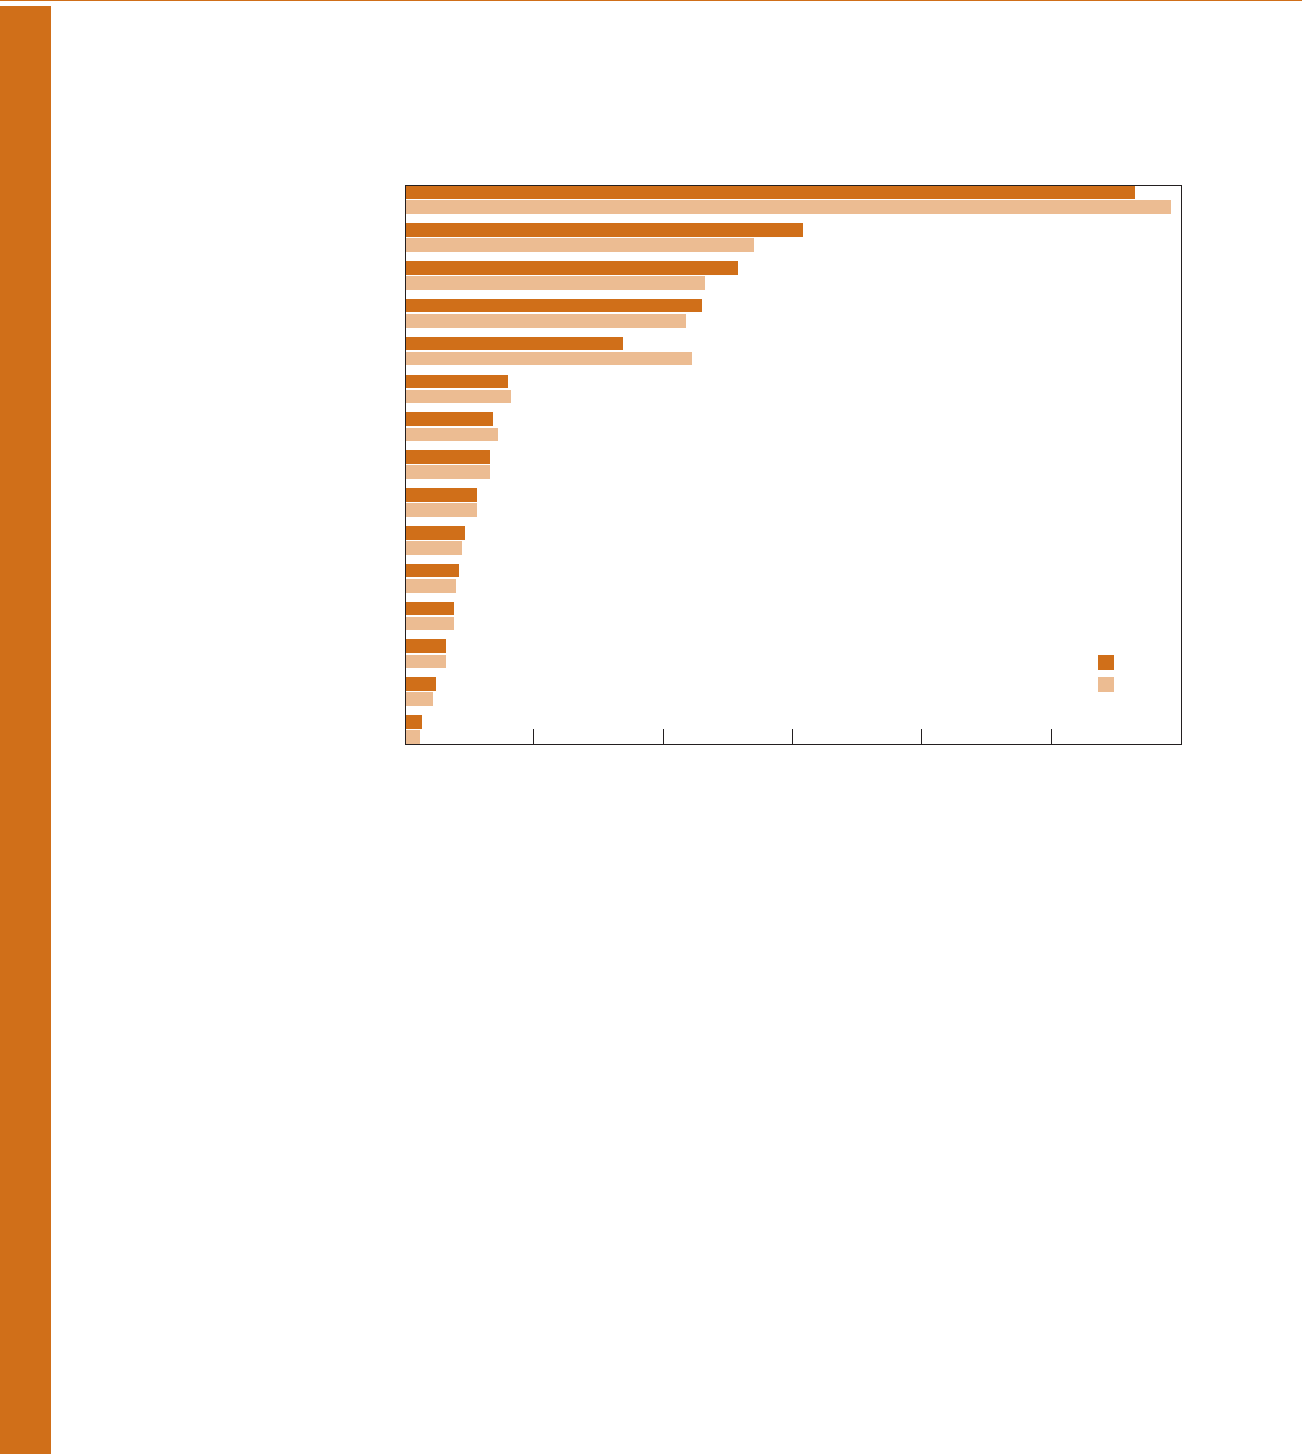
Note: Graph data are shown net of provisions and reverse repurchase agreements.
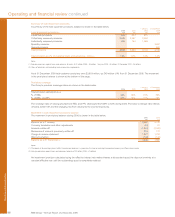
As at 31 December 2006, 28% of credit risk assets (2005 – 30%) related to individuals and include mortgage lending and other
smaller loans that are intrinsically well-diversified. Corporate industry exposure comprised 36% of credit risk assets (2005 – 35%),
which are well diversified across a range of sectors. Banks and financial sevices account for 20% of credit risk assets (2005 – 22%)
and public sector and quasi government credit risk assets make up the remaining 16% (2005 – 13%).
Distribution of credit risk assets by industry sector
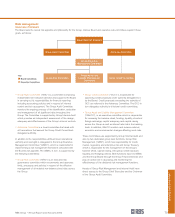
Industry analysis plays an important part in assessing potential concentration risk from within the loan portfolio. Particular attention is
given to industry sectors where the Group believes there is a high degree of risk or potential for volatility in the future.
The Group also uses scenario analysis and stress testing in order to monitor the risk to clusters of correlated industry sectors.
Individuals
Public sectors and
quasi government
Property
Financial services
Banks
Transport and storage
Manufacturing
Wholesale and retail trade
Tourism and leisure
Building and construction
Business services
Tech nology, media and
telecommunications
Power and water
Natural resources and nuclear
Agriculture and fisheries
5%0%10%15%20%25%30%
2006
2005