RBS 2006 Annual Report Download - page 56
Download and view the complete annual report
Please find page 56 of the 2006 RBS annual report below. You can navigate through the pages in the report by either clicking on the pages listed below, or by using the keyword search tool below to find specific information within the annual report.-
 1
1 -
2
-
3
-
4
-
5
-
6
-
7
-
8
-
9
-
10
-
11
-
12
-
13
-
14
-
15
-
16
-
17
-
18
-
19
-
20
-
21
-
22
-
23
-
24
-
25
-
26
-
27
-
28
-
29
-
30
-
31
-
32
-
33
-
34
-
35
-
36
-
37
-
38
-
39
-
40
-
41
-
42
-
43
-
44
-
45
-
 46
46 -
 47
47 -
 48
48 -
 49
49 -
 50
50 -
 51
51 -
 52
52 -
 53
53 -
 54
54 -
 55
55 -
 56
56 -
 57
57 -
 58
58 -
 59
59 -
 60
60 -
 61
61 -
 62
62 -
 63
63 -
 64
64 -
 65
65 -
 66
66 -
67
-
68
-
69
-
70
-
71
-
72
-
73
-
74
-
75
-
76
-
77
-
78
-
79
-
80
-
81
-
82
-
83
-
84
-
85
-
86
-
87
-
88
-
89
-
90
-
91
-
92
-
93
-
94
-
95
-
96
-
97
-
98
-
99
-
100
-
101
-
102
-
103
-
104
-
105
-
106
-
107
-
108
-
109
-
110
-
111
-
112
-
113
-
114
-
115
-
116
-
117
-
118
-
119
-
120
-
121
-
122
-
123
-
124
-
125
-
126
-
127
-
128
-
129
-
130
-
131
-
132
-
133
-
134
-
135
-
136
-
137
-
138
-
139
-
140
-
141
-
142
-
143
-
144
-
145
-
146
-
147
-
148
-
149
-
150
-
151
-
152
-
153
-
154
-
155
-
156
-
157
-
158
-
159
-
160
-
161
-
162
-
163
-
164
-
165
-
166
-
167
-
168
-
169
-
170
-
171
-
172
-
173
-
174
-
175
-
176
-
177
-
178
-
179
-
180
-
181
-
182
-
183
-
184
-
185
-
186
-
187
-
188
-
189
-
190
-
191
-
192
-
193
-
194
-
195
-
196
-
197
-
198
-
199
-
200
-
201
-
202
-
203
-
204
-
205
-
206
-
207
-
208
-
209
-
210
-
211
-
212
-
213
-
214
-
215
-
216
-
217
-
218
-
219
-
220
-
221
-
222
-
223
-
224
-
225
-
226
-
227
-
228
-
229
-
230
-
231
-
232
-
233
-
234
-
235
-
236
-
237
-
238
-
239
-
240
-
241
-
242
-
243
-
244
-
245
-
246
-
247
-
248
-
249
-
250
-
251
-
252
-
253
-
254
-
255
-
256
-
257
-
258
-
259
-
260
-
261
-
262
 |
 |

55
RBS Group • Annual Report and Accounts 2006
Operating and financial review
2006 compared with 2005
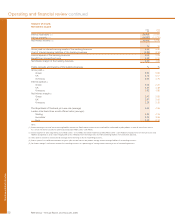
Non-interest income increased by £1,755 million, 11% to
£17,406 million reflecting strong organic growth in all divisions
especially Global Banking & Markets, up 27% and Wealth
Management, up 17%. Non-interest income represents 62% of
total income (2005 – 61%). Excluding general insurance
premium income, non-interest income rose by 16% or £1,561
million to £11,433 million.
Within non-interest income, fees and commissions receivable
increased by 5% or £366 million, to £7,116 million, while fees
and commissions payable increased by 4%, £81 million to
£1,922 million.
Income from trading activities, which primarily arises from
providing customers with debt and risk management products
in interest rate, currency and credit, was up £332 million, 14%,
reflecting increased customer volumes.
Other operating income increased by 36%, £944 million to
£3,564 million. This was principally due to growth in income from
rental and asset-backed activities and principal investments in
Corporate Markets.
General insurance premium income, after reinsurance, rose by
3%, or £194 million to £5,973 million with good growth in motor
policies in the UK and Continental Europe.
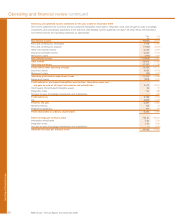
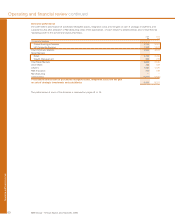
Non-interest income
2006 2005
£m £m
Fees and commissions receivable 7,116 6,750
Fees and commissions payable (1,922) (1,841)
Income from trading activities 2,675 2,343
Other operating income 3,564 2,620
11,433 9,872
Insurance premium income 6,243 6,076
Reinsurers’ share (270) (297)
5,973 5,779
17,406 15,651