RBS 2006 Annual Report Download - page 145
Download and view the complete annual report
Please find page 145 of the 2006 RBS annual report below. You can navigate through the pages in the report by either clicking on the pages listed below, or by using the keyword search tool below to find specific information within the annual report.-
 1
1 -
2
-
3
-
4
-
5
-
6
-
7
-
8
-
9
-
10
-
11
-
12
-
13
-
14
-
15
-
16
-
17
-
18
-
19
-
20
-
21
-
22
-
23
-
24
-
25
-
26
-
27
-
28
-
29
-
30
-
31
-
32
-
33
-
34
-
35
-
36
-
37
-
38
-
39
-
40
-
41
-
42
-
43
-
44
-
45
-
46
-
47
-
48
-
49
-
50
-
51
-
52
-
53
-
54
-
55
-
56
-
57
-
58
-
59
-
60
-
61
-
62
-
63
-
64
-
65
-
66
-
67
-
68
-
69
-
70
-
71
-
72
-
73
-
74
-
75
-
76
-
77
-
78
-
79
-
80
-
81
-
82
-
83
-
84
-
85
-
86
-
87
-
88
-
89
-
90
-
91
-
92
-
93
-
94
-
95
-
96
-
97
-
98
-
99
-
100
-
101
-
102
-
103
-
104
-
105
-
106
-
107
-
108
-
109
-
110
-
111
-
112
-
113
-
114
-
115
-
116
-
117
-
118
-
119
-
120
-
121
-
122
-
123
-
124
-
125
-
126
-
127
-
128
-
129
-
130
-
131
-
132
-
133
-
134
-
 135
135 -
 136
136 -
 137
137 -
 138
138 -
 139
139 -
 140
140 -
 141
141 -
 142
142 -
 143
143 -
 144
144 -
 145
145 -
 146
146 -
 147
147 -
 148
148 -
 149
149 -
 150
150 -
 151
151 -
 152
152 -
 153
153 -
 154
154 -
 155
155 -
156
-
157
-
158
-
159
-
160
-
161
-
162
-
163
-
164
-
165
-
166
-
167
-
168
-
169
-
170
-
171
-
172
-
173
-
174
-
175
-
176
-
177
-
178
-
179
-
180
-
181
-
182
-
183
-
184
-
185
-
186
-
187
-
188
-
189
-
190
-
191
-
192
-
193
-
194
-
195
-
196
-
197
-
198
-
199
-
200
-
201
-
202
-
203
-
204
-
205
-
206
-
207
-
208
-
209
-
210
-
211
-
212
-
213
-
214
-
215
-
216
-
217
-
218
-
219
-
220
-
221
-
222
-
223
-
224
-
225
-
226
-
227
-
228
-
229
-
230
-
231
-
232
-
233
-
234
-
235
-
236
-
237
-
238
-
239
-
240
-
241
-
242
-
243
-
244
-
245
-
246
-
247
-
248
-
249
-
250
-
251
-
252
-
253
-
254
-
255
-
256
-
257
-
258
-
259
-
260
-
261
-
262
 |
 |

RBS Group • Annual Report and Accounts 2006
144
Notes on the accounts continued
Financial statements
Main scheme All schemes
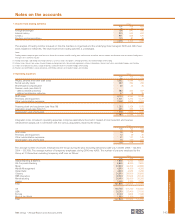
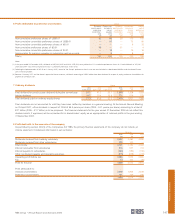
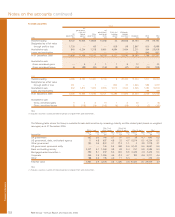
Principal actuarial assumptions at 31 December 2006 2005 2004 2006 2005 2004
weighted average
Discount rate 5.3% 4.8% 5.4% 5.3% 4.8% 5.4%
Expected return on plan assets (weighted average) 6.9% 6.5% 6.7% 6.9% 6.5% 6.8%
Rate of increase in salaries 4.2% 4.0% 4.0% 4.1% 3.9% 3.9%
Rate of increase in pensions in payment 2.9% 2.7% 2.7% 2.8% 2.6% 2.7%
Inflation assumption 2.9% 2.7% 2.7% 2.9% 2.7% 2.7%
Main scheme All schemes
Major classes of plan assets as a percentage of total plan assets 2006 2005 2004 2006 2005 2004
Equities 60.5% 61.3% 56.7% 60.7% 61.6% 57.2%
Index-linked bonds 17.3% 18.1% 16.5% 16.1% 16.8% 15.3%
Government fixed interest bonds 2.5% 1.8% 2.1% 3.3% 2.6% 2.8%
Corporate and other bonds 14.0% 14.6% 12.5% 13.9% 14.6% 12.7%
Property 4.3% 3.6% 3.1% 4.5% 3.7% 3.2%
Cash and other assets 1.4% 0.6% 9.1% 1.5% 0.7% 8.8%
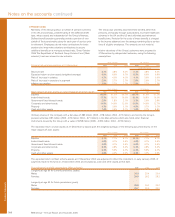
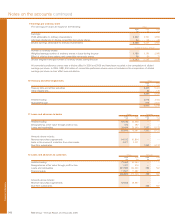
Ordinary shares of the company with a fair value of £89 million (2005 – £78 million; 2004 – £73 million), are held by the Group’s
pension schemes; £87 million (2005 – £76 million; 2004 – £71 million) in the Main scheme which also holds other financial
instruments issued by the Group with a value of £258 million (2005 – £299 million; 2004 – £726 million).
The expected return on plan assets at 31 December is based upon the weighted average of the following assumed returns on the
major classes of plan assets:
Main scheme All schemes
2006 2005 2004 2006 2005 2004
Equities 8.1% 7.7% 8.1% 8.1% 7.7% 8.1%
Index-linked bonds 4.5% 4.1% 4.5% 4.5% 4.1% 4.5%
Government fixed interest bonds 4.5% 4.1% 4.5% 4.5% 4.1% 4.5%
Corporate and other bonds 5.3% 4.8% 5.4% 5.3% 4.8% 5.4%
Property 6.3% 5.9% 6.3% 6.3% 5.9% 6.3%
Cash and other assets 4.6% 4.2% 4.6% 4.4% 3.7% 4.5%
The expected return on Main scheme assets at 31 December 2004 was adjusted to reflect the investment, in early January 2005, of
payments made to the fund on 31 December 2004 and included as cash and other assets at that date.
Post-retirement mortality assumptions (Main scheme) 2006 2005 2004
Longevity at age 60 for current pensioners (years)
Males 26.0 25.4 25.4
Females 28.9 28.2 28.2
Longevity at age 60 for future pensioners (years)
Males 26.8 26.2 26.2
Females 29.7 29.0 29.0
3 Pension costs
Members of the Group sponsor a number of pension schemes
in the UK and overseas, predominantly of the defined benefit
type, whose assets are independent of the Group’s finances.
Defined benefit pensions generally provide a pension of one-
sixtieth of final pensionable salary for each year of service prior
to retirement. Employees do not make contributions for basic
pensions but may make voluntary contributions to secure
additional benefits on a money-purchase basis. Since October
2006 The Royal Bank of Scotland Group Pension Fund (‘Main
scheme’) has been closed to new entrants.
The Group also provides post-retirement benefits other than
pensions, principally through subscriptions to private healthcare
schemes in the UK and the US and unfunded post-retirement
benefit plans. Provision for the costs of these benefits is charged
to the income statement over the average remaining future service
lives of eligible employees. The amounts are not material.
Interim valuations of the Group’s schemes were prepared to
31 December by independent actuaries, using the following
assumptions: