RBS 2006 Annual Report Download - page 192
Download and view the complete annual report
Please find page 192 of the 2006 RBS annual report below. You can navigate through the pages in the report by either clicking on the pages listed below, or by using the keyword search tool below to find specific information within the annual report.-
 1
1 -
2
-
3
-
4
-
5
-
6
-
7
-
8
-
9
-
10
-
11
-
12
-
13
-
14
-
15
-
16
-
17
-
18
-
19
-
20
-
21
-
22
-
23
-
24
-
25
-
26
-
27
-
28
-
29
-
30
-
31
-
32
-
33
-
34
-
35
-
36
-
37
-
38
-
39
-
40
-
41
-
42
-
43
-
44
-
45
-
46
-
47
-
48
-
49
-
50
-
51
-
52
-
53
-
54
-
55
-
56
-
57
-
58
-
59
-
60
-
61
-
62
-
63
-
64
-
65
-
66
-
67
-
68
-
69
-
70
-
71
-
72
-
73
-
74
-
75
-
76
-
77
-
78
-
79
-
80
-
81
-
82
-
83
-
84
-
85
-
86
-
87
-
88
-
89
-
90
-
91
-
92
-
93
-
94
-
95
-
96
-
97
-
98
-
99
-
100
-
101
-
102
-
103
-
104
-
105
-
106
-
107
-
108
-
109
-
110
-
111
-
112
-
113
-
114
-
115
-
116
-
117
-
118
-
119
-
120
-
121
-
122
-
123
-
124
-
125
-
126
-
127
-
128
-
129
-
130
-
131
-
132
-
133
-
134
-
135
-
136
-
137
-
138
-
139
-
140
-
141
-
142
-
143
-
144
-
145
-
146
-
147
-
148
-
149
-
150
-
151
-
152
-
153
-
154
-
155
-
156
-
157
-
158
-
159
-
160
-
161
-
162
-
163
-
164
-
165
-
166
-
167
-
168
-
169
-
170
-
171
-
172
-
173
-
174
-
175
-
176
-
177
-
178
-
179
-
180
-
181
-
 182
182 -
 183
183 -
 184
184 -
 185
185 -
 186
186 -
 187
187 -
 188
188 -
 189
189 -
 190
190 -
 191
191 -
 192
192 -
 193
193 -
 194
194 -
 195
195 -
 196
196 -
 197
197 -
 198
198 -
 199
199 -
 200
200 -
 201
201 -
 202
202 -
203
-
204
-
205
-
206
-
207
-
208
-
209
-
210
-
211
-
212
-
213
-
214
-
215
-
216
-
217
-
218
-
219
-
220
-
221
-
222
-
223
-
224
-
225
-
226
-
227
-
228
-
229
-
230
-
231
-
232
-
233
-
234
-
235
-
236
-
237
-
238
-
239
-
240
-
241
-
242
-
243
-
244
-
245
-
246
-
247
-
248
-
249
-
250
-
251
-
252
-
253
-
254
-
255
-
256
-
257
-
258
-
259
-
260
-
261
-
262
 |
 |

RBS Group • Annual Report and Accounts 2006 191
Financial statements
Group
After 3 After 6 After 1
months months year Total Non Fair value
but less but less but less interest interest through Banking Trading
3 months than than than Over 5 earning/ earning/ profit or book book
or less 6 months 1 year 5 years years bearing Yield bearing loss total total Total
2006 £m £m £m £m £m £m % £m £m £m £m £m
Assets
Loans and advances
to banks 20,628 1,869 2,095 105 55 24,752 4.50 3,252 376 28,380 54,226 82,606
Loans and advances
to customers 256,410 14,629 13,506 48,365 36,851 369,761 6.17 17,598 1,327 388,686 78,207 466,893
Debt securities and
treasury bills 7,779 1,879 1,729 4,166 11,689 27,242 4.93 3 5,619 32,864 99,878 132,742
Other assets 3,242 — — — — 3,242 59,334 — 62,576 126,615 189,191
Total assets 288,059 18,377 17,330 52,636 48,595 424,997 5.95 80,187 7,322 512,506 358,926 871,432
Liabilities and equity
Deposits by banks 52,301 26 2,502 474 1,261 56,564 4.36 1,625 — 58,189 73,954 132,143
Customer accounts 262,010 7,512 6,188 5,758 1,459 282,927 3.31 37,375 3,922 324,224 59,998 384,222
Debt securities in issue 63,245 2,516 2,133 1,320 2,013 71,227 4.54 243 10,499 81,969 3,994 85,963
Subordinated liabilities 7,298 1,127 273 4,844 13,646 27,188 5.92 — 124 27,312 342 27,654
Other liabilities — — — — — — 33,974 — 33,974 167,249 201,223
Shareholders’ equity — — — — — — 38,411 — 38,411 1,816 40,227
Internal funding of
trading business (43,864) (5,443) (92) (2,009) — (51,408) 4.78 (165) — (51,573) 51,573 —
Total liabilities and equity 340,990 5,738 11,004 10,387 18,379 386,498 4.32 111,463 14,545 512,506 358,926 871,432
Interest rate swaps 18,843 (4,371)(10,626)(11,528) 7,682 — — —
Interest rate sensitivity gap (34,088) 8,268 (4,300) 30,721 37,898 38,499 (31,276) (7,223)
Cumulative interest rate
sensitivity gap ( 34,088) (25,820)(30,120) 601 38,499 38,499 7,223 —
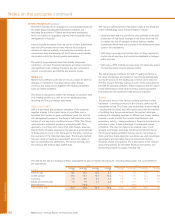
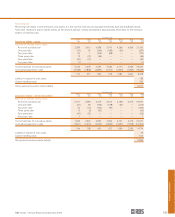
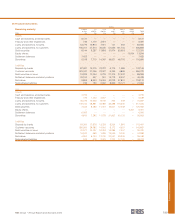
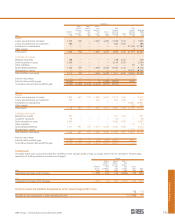
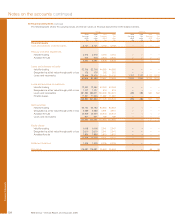
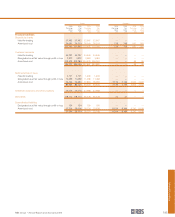
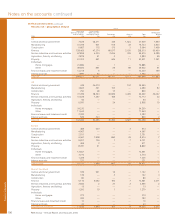
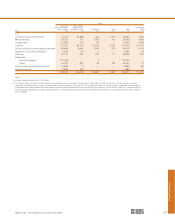
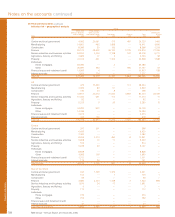
Interest rate sensitivity
The following tables summarise the interest rate sensitivity gap
for the Group and the company at 31 December 2006 and 31
December 2005. The tables show the contractual repricing for
each category of asset, liability and off-balance sheet items in
the banking book. A liability (or negative) gap position exists
when liabilities reprice more quickly or in greater proportion
than assets during a given period and tends to benefit net
interest income in a declining interest rate environment. An
asset (or positive) gap position exists when assets reprice
more quickly or in greater proportion than liabilities during a
given period and tends to benefit net interest income in a rising
interest rate environment. The actual interest rate sensitivity of
the Group’s earnings will be determined by the currency and
contractual or behavioural profile of assets and liabilities, in
addition to the size and timing of interest rate movements.
Contractual repricing terms do not reflect the potential impact
of early repayment or withdrawal. Positions may not be
reflective of those in subsequent periods. Major changes in
positions can be made promptly as market outlooks change.
In addition, significant variations in interest rate sensitivity may
exist within the re-pricing periods presented and among the
currencies in which the Group has interest rate positions.