RBS 2006 Annual Report Download - page 87
Download and view the complete annual report
Please find page 87 of the 2006 RBS annual report below. You can navigate through the pages in the report by either clicking on the pages listed below, or by using the keyword search tool below to find specific information within the annual report.-
 1
1 -
2
-
3
-
4
-
5
-
6
-
7
-
8
-
9
-
10
-
11
-
12
-
13
-
14
-
15
-
16
-
17
-
18
-
19
-
20
-
21
-
22
-
23
-
24
-
25
-
26
-
27
-
28
-
29
-
30
-
31
-
32
-
33
-
34
-
35
-
36
-
37
-
38
-
39
-
40
-
41
-
42
-
43
-
44
-
45
-
46
-
47
-
48
-
49
-
50
-
51
-
52
-
53
-
54
-
55
-
56
-
57
-
58
-
59
-
60
-
61
-
62
-
63
-
64
-
65
-
66
-
67
-
68
-
69
-
70
-
71
-
72
-
73
-
74
-
75
-
76
-
 77
77 -
 78
78 -
 79
79 -
 80
80 -
 81
81 -
 82
82 -
 83
83 -
 84
84 -
 85
85 -
 86
86 -
 87
87 -
 88
88 -
 89
89 -
 90
90 -
 91
91 -
 92
92 -
 93
93 -
 94
94 -
 95
95 -
 96
96 -
 97
97 -
98
-
99
-
100
-
101
-
102
-
103
-
104
-
105
-
106
-
107
-
108
-
109
-
110
-
111
-
112
-
113
-
114
-
115
-
116
-
117
-
118
-
119
-
120
-
121
-
122
-
123
-
124
-
125
-
126
-
127
-
128
-
129
-
130
-
131
-
132
-
133
-
134
-
135
-
136
-
137
-
138
-
139
-
140
-
141
-
142
-
143
-
144
-
145
-
146
-
147
-
148
-
149
-
150
-
151
-
152
-
153
-
154
-
155
-
156
-
157
-
158
-
159
-
160
-
161
-
162
-
163
-
164
-
165
-
166
-
167
-
168
-
169
-
170
-
171
-
172
-
173
-
174
-
175
-
176
-
177
-
178
-
179
-
180
-
181
-
182
-
183
-
184
-
185
-
186
-
187
-
188
-
189
-
190
-
191
-
192
-
193
-
194
-
195
-
196
-
197
-
198
-
199
-
200
-
201
-
202
-
203
-
204
-
205
-
206
-
207
-
208
-
209
-
210
-
211
-
212
-
213
-
214
-
215
-
216
-
217
-
218
-
219
-
220
-
221
-
222
-
223
-
224
-
225
-
226
-
227
-
228
-
229
-
230
-
231
-
232
-
233
-
234
-
235
-
236
-
237
-
238
-
239
-
240
-
241
-
242
-
243
-
244
-
245
-
246
-
247
-
248
-
249
-
250
-
251
-
252
-
253
-
254
-
255
-
256
-
257
-
258
-
259
-
260
-
261
-
262
 |
 |

RBS Group • Annual Report and Accounts 2006
86
Operating and financial review continued
Operating and financial review
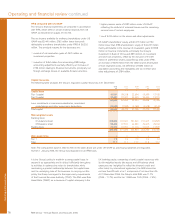
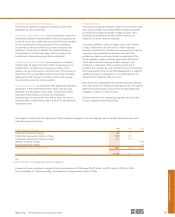
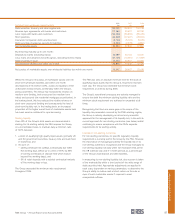
The table below sets out the Group’s loans that are classified as REIL and PPL:
1 January 31 December
2006 2005 2005 2004
REIL and PPL £m £m £m £m
Non-accrual loans (1) 6,232 5,926 5,836 4,733
Accrual loans past due 90 days (2) 105 9 52 713
Troubled debt restructurings (3) —2—24
Total REIL 6,337 5,937 5,888 5,470
PPL (4) 52 19 11 280
Total REIL and PPL 6,389 5,956 5,899 5,750
REIL and PPL as % of customer loans and advances – gross (5) 1.57% 1.60% 1.84% 1.92%
Following the implementation of IAS 39 in 2005, the sub-categories of REIL and PPL are calculated as per notes 1 to 4 below.
Notes:
(1) All loans against which an impairment provision is held are reported in the non-accrual category.
(2) Loans where an impairment event has taken place but no impairment recognised. This category is used for fully collateralised non-revolving credit facilities.
(3) Troubled debt restructurings represent loans that have been restructured following the granting of a concession by the Group to the borrower.
(4) Loans for which an impairment event has occurred but no impairment provision is necessary. This category is used for fully collateralised advances and revolving credit facilities
where identification as 90 days overdue is not feasible.
(5) Gross of provisions and excluding reverse repurchase agreements.
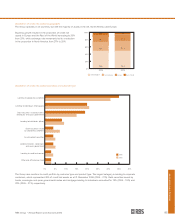
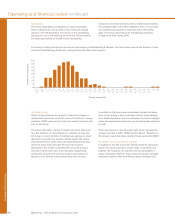
REIL as at 31 December 2006 was £6,337 million (2005 – £5,937 million), an increase of £400 million (7%) during the year.
As a percentage of customer lending, REIL and PPL in aggregate show an improving trend, amounting to 1.57% of customer loans
and advances at 31 December 2006 (2005 – 1.60%).
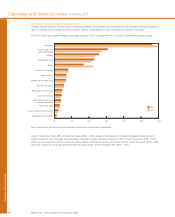
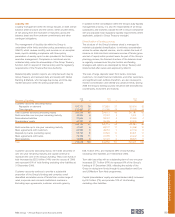
REIL by division
The table below shows REIL by division.
1 January 31 December
2006 2005 2005 2004
REIL £m £m £m £m
Corporate Markets
– Global Banking & Markets 492 496 1,066 937
– UK Corporate Banking 1,034 969 1,032 955
Retail Markets
– Retail 4,143 3,877 3,197 3,000
– Wealth Management 43 58 65 99
Ulster Bank 433 342 389 341
Citizens 175 195 136 135
Other 17 —33
Total REIL 6,337 5,937 5,888 5,470
During 2006, REIL in Corporate Markets rose by £61 million but remained at historically low levels reflecting continued favourable
conditions in the corporate environment in the UK, Europe and the US. In addition, REIL increased in Retail by £266 million (7%) due
to ongoing challenging conditions in the UK consumer environment.
Loan impairment
The Group classifies impaired assets as either Risk Elements
in Lending (“REIL”) or Potential Problem Loans (“PPL”). REIL
represents non-accrual loans, loans that are accruing but
are past due 90 days and restructured loans. PPL represents
impaired assets which are not included in REIL but where
known information about possible credit problems cause
management to have serious doubts about the future ability
of the borrower to comply with loan repayment terms.
Both REIL and PPL are reported gross of the value of any
security held, which could reduce the eventual loss should it
occur, and gross of any provision marked. Therefore impaired
assets which are highly collateralised, such as mortgages, will
have a low coverage ratio of provisions held against reported
impaired balance.
The adoption of IAS 39 under IFRS at the beginning of 2005
resulted in changes to the methodology used to identify
impaired assets and therefore the way that REIL is calculated.
Comparative financial information is given in the following
tables for both 1 January 2005 and 31 December 2004.