RBS 2006 Annual Report Download - page 63
Download and view the complete annual report
Please find page 63 of the 2006 RBS annual report below. You can navigate through the pages in the report by either clicking on the pages listed below, or by using the keyword search tool below to find specific information within the annual report.-
 1
1 -
2
-
3
-
4
-
5
-
6
-
7
-
8
-
9
-
10
-
11
-
12
-
13
-
14
-
15
-
16
-
17
-
18
-
19
-
20
-
21
-
22
-
23
-
24
-
25
-
26
-
27
-
28
-
29
-
30
-
31
-
32
-
33
-
34
-
35
-
36
-
37
-
38
-
39
-
40
-
41
-
42
-
43
-
44
-
45
-
46
-
47
-
48
-
49
-
50
-
51
-
52
-
 53
53 -
 54
54 -
 55
55 -
 56
56 -
 57
57 -
 58
58 -
 59
59 -
 60
60 -
 61
61 -
 62
62 -
 63
63 -
 64
64 -
 65
65 -
 66
66 -
 67
67 -
 68
68 -
 69
69 -
 70
70 -
 71
71 -
 72
72 -
 73
73 -
74
-
75
-
76
-
77
-
78
-
79
-
80
-
81
-
82
-
83
-
84
-
85
-
86
-
87
-
88
-
89
-
90
-
91
-
92
-
93
-
94
-
95
-
96
-
97
-
98
-
99
-
100
-
101
-
102
-
103
-
104
-
105
-
106
-
107
-
108
-
109
-
110
-
111
-
112
-
113
-
114
-
115
-
116
-
117
-
118
-
119
-
120
-
121
-
122
-
123
-
124
-
125
-
126
-
127
-
128
-
129
-
130
-
131
-
132
-
133
-
134
-
135
-
136
-
137
-
138
-
139
-
140
-
141
-
142
-
143
-
144
-
145
-
146
-
147
-
148
-
149
-
150
-
151
-
152
-
153
-
154
-
155
-
156
-
157
-
158
-
159
-
160
-
161
-
162
-
163
-
164
-
165
-
166
-
167
-
168
-
169
-
170
-
171
-
172
-
173
-
174
-
175
-
176
-
177
-
178
-
179
-
180
-
181
-
182
-
183
-
184
-
185
-
186
-
187
-
188
-
189
-
190
-
191
-
192
-
193
-
194
-
195
-
196
-
197
-
198
-
199
-
200
-
201
-
202
-
203
-
204
-
205
-
206
-
207
-
208
-
209
-
210
-
211
-
212
-
213
-
214
-
215
-
216
-
217
-
218
-
219
-
220
-
221
-
222
-
223
-
224
-
225
-
226
-
227
-
228
-
229
-
230
-
231
-
232
-
233
-
234
-
235
-
236
-
237
-
238
-
239
-
240
-
241
-
242
-
243
-
244
-
245
-
246
-
247
-
248
-
249
-
250
-
251
-
252
-
253
-
254
-
255
-
256
-
257
-
258
-
259
-
260
-
261
-
262
 |
 |

RBS Group • Annual Report and Accounts 2006
62
Operating and financial review continued
Operating and financial review
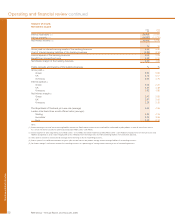
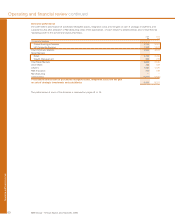
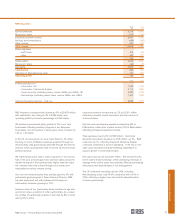
Corporate Markets – Global Banking & Markets
2006 2005
£m £m
Net interest income from banking activities 1,629 1,486
Net fees and commissions receivable 998 790
Trading activities 2,242 1,949
Net income from rental assets (net of related funding costs) 677 622
Other operating income (net of related funding costs) 1,280 744
Non-interest income 5,197 4,105
Total income 6,826 5,591
Direct expenses
– staff costs 1,975 1,518
– other 427 357
– operating lease depreciation 406 398
2,808 2,273
Contribution before impairment losses 4,018 3,318
Impairment losses 85 139
Contribution 3,933 3,179
Allocation of Manufacturing costs 143 138
Operating profit 3,790 3,041
£bn £bn
Total assets* 383.6 330.9
Loans and advances to customers – gross*
– banking book 94.3 82.0
– trading book 15.4 11.8
Rental assets 12.2 11.9
Customer deposits* 54.1 44.7
Risk-weighted assets 138.1 120.0
* excluding repos and reverse repos
Global Banking & Markets performed strongly in 2006,
delivering excellent growth in income while continuing to build
our strong international franchise. Total income rose by 22% to
£6,826 million, contribution by 24% to £3,933 million and
operating profit by 25% to £3,790 million.
GBM is a leading provider of debt financing and risk
management solutions covering the origination, structuring and
distribution of a wide range of assets. In 2006 we arranged
over $450 billion of financing for our corporate and institutional
customers, up 17% from 2005. We ranked first among
managers of global asset-backed and mortgage-backed
securitisations and fourth among managers of global
syndicated loans, while among managers of international
bonds we moved from thirteenth place to eighth. These league
table positions demonstrate our success in broadening and
deepening our franchise.
In 2006 we have further invested in extending our product
capabilities and our worldwide reach. Income in North America
rose by 18% in local currency, despite flat revenues in our US
residential mortgage-backed securities business, as the
investments we have made in our debt capital markets, loan
markets, rates and credit trading businesses have borne fruit.
In Europe, income increased by 26% in local currency as a
result of good performances in Germany, France, Spain, Italy
and the Nordic region. We participated in many of the largest
cross-border financings in 2006. Asia-Pacific, too, showed
marked progress, with income increasing by 35% in US dollar
terms. We have established a promising presence in the
region, building our product capability and client relationships.