RBS 2006 Annual Report Download - page 86
Download and view the complete annual report
Please find page 86 of the 2006 RBS annual report below. You can navigate through the pages in the report by either clicking on the pages listed below, or by using the keyword search tool below to find specific information within the annual report.-
 1
1 -
2
-
3
-
4
-
5
-
6
-
7
-
8
-
9
-
10
-
11
-
12
-
13
-
14
-
15
-
16
-
17
-
18
-
19
-
20
-
21
-
22
-
23
-
24
-
25
-
26
-
27
-
28
-
29
-
30
-
31
-
32
-
33
-
34
-
35
-
36
-
37
-
38
-
39
-
40
-
41
-
42
-
43
-
44
-
45
-
46
-
47
-
48
-
49
-
50
-
51
-
52
-
53
-
54
-
55
-
56
-
57
-
58
-
59
-
60
-
61
-
62
-
63
-
64
-
65
-
66
-
67
-
68
-
69
-
70
-
71
-
72
-
73
-
74
-
75
-
 76
76 -
 77
77 -
 78
78 -
 79
79 -
 80
80 -
 81
81 -
 82
82 -
 83
83 -
 84
84 -
 85
85 -
 86
86 -
 87
87 -
 88
88 -
 89
89 -
 90
90 -
 91
91 -
 92
92 -
 93
93 -
 94
94 -
 95
95 -
 96
96 -
97
-
98
-
99
-
100
-
101
-
102
-
103
-
104
-
105
-
106
-
107
-
108
-
109
-
110
-
111
-
112
-
113
-
114
-
115
-
116
-
117
-
118
-
119
-
120
-
121
-
122
-
123
-
124
-
125
-
126
-
127
-
128
-
129
-
130
-
131
-
132
-
133
-
134
-
135
-
136
-
137
-
138
-
139
-
140
-
141
-
142
-
143
-
144
-
145
-
146
-
147
-
148
-
149
-
150
-
151
-
152
-
153
-
154
-
155
-
156
-
157
-
158
-
159
-
160
-
161
-
162
-
163
-
164
-
165
-
166
-
167
-
168
-
169
-
170
-
171
-
172
-
173
-
174
-
175
-
176
-
177
-
178
-
179
-
180
-
181
-
182
-
183
-
184
-
185
-
186
-
187
-
188
-
189
-
190
-
191
-
192
-
193
-
194
-
195
-
196
-
197
-
198
-
199
-
200
-
201
-
202
-
203
-
204
-
205
-
206
-
207
-
208
-
209
-
210
-
211
-
212
-
213
-
214
-
215
-
216
-
217
-
218
-
219
-
220
-
221
-
222
-
223
-
224
-
225
-
226
-
227
-
228
-
229
-
230
-
231
-
232
-
233
-
234
-
235
-
236
-
237
-
238
-
239
-
240
-
241
-
242
-
243
-
244
-
245
-
246
-
247
-
248
-
249
-
250
-
251
-
252
-
253
-
254
-
255
-
256
-
257
-
258
-
259
-
260
-
261
-
262
 |
 |

85
RBS Group • Annual Report and Accounts 2006
Operating and financial review
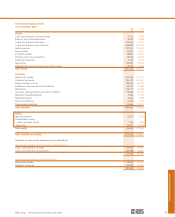
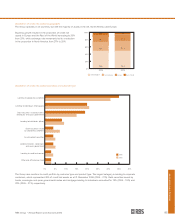
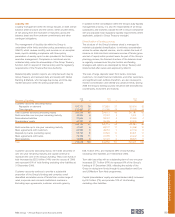
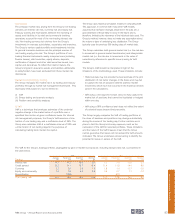
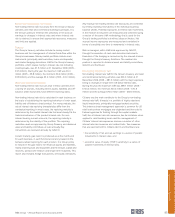
Distribution of credit risk assets by geography
The Group operates in 43 countries, but with the majority of assets in the UK, North America and Europe.
Business growth resulted in the proportion of credit risk
assets in Europe and the Rest of the World increasing to 26%
from 23%, while exchange rate movements led to a reduction
in the proportion in North America from 27% to 25%.
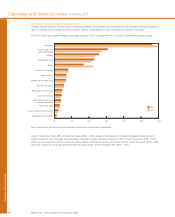
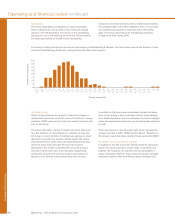
Distribution of credit risk assets by product and customer type
The Group also monitors its credit portfolio by customer type and product type. The largest category is lending to corporate
customers, which represented 35% of credit risk assets as at 31 December 2006 (2005 – 31%). Debt securities issued by
banks, sovereigns and quasi government bodies and mortgage lending to individuals accounted for 19% (2005 – 15%) and
20% (2005 – 21%) respectively.
0%
20%
40%
60%
80%
100%
Rest of World
Europe
United KingdomNorth America
2006 2005
48.8 49.3
25.1 27.3
19.7 18.2
6.4 5.2
0%5%10%15%20%25%30%35%40%
2005
2006
Lending to corporate customers
Lending to individuals (mortgages)
Debt securities issued by banks,
sovereigns and quasi government
Lending to individuals (other)
Debt securities issued
by corporate customers
Asset-backed securities
Lending to banks, sovereigns
and quasi government
Lending to small businesses
Other and off-balance sheet