RBS 2006 Annual Report Download - page 236
Download and view the complete annual report
Please find page 236 of the 2006 RBS annual report below. You can navigate through the pages in the report by either clicking on the pages listed below, or by using the keyword search tool below to find specific information within the annual report.-
 1
1 -
2
-
3
-
4
-
5
-
6
-
7
-
8
-
9
-
10
-
11
-
12
-
13
-
14
-
15
-
16
-
17
-
18
-
19
-
20
-
21
-
22
-
23
-
24
-
25
-
26
-
27
-
28
-
29
-
30
-
31
-
32
-
33
-
34
-
35
-
36
-
37
-
38
-
39
-
40
-
41
-
42
-
43
-
44
-
45
-
46
-
47
-
48
-
49
-
50
-
51
-
52
-
53
-
54
-
55
-
56
-
57
-
58
-
59
-
60
-
61
-
62
-
63
-
64
-
65
-
66
-
67
-
68
-
69
-
70
-
71
-
72
-
73
-
74
-
75
-
76
-
77
-
78
-
79
-
80
-
81
-
82
-
83
-
84
-
85
-
86
-
87
-
88
-
89
-
90
-
91
-
92
-
93
-
94
-
95
-
96
-
97
-
98
-
99
-
100
-
101
-
102
-
103
-
104
-
105
-
106
-
107
-
108
-
109
-
110
-
111
-
112
-
113
-
114
-
115
-
116
-
117
-
118
-
119
-
120
-
121
-
122
-
123
-
124
-
125
-
126
-
127
-
128
-
129
-
130
-
131
-
132
-
133
-
134
-
135
-
136
-
137
-
138
-
139
-
140
-
141
-
142
-
143
-
144
-
145
-
146
-
147
-
148
-
149
-
150
-
151
-
152
-
153
-
154
-
155
-
156
-
157
-
158
-
159
-
160
-
161
-
162
-
163
-
164
-
165
-
166
-
167
-
168
-
169
-
170
-
171
-
172
-
173
-
174
-
175
-
176
-
177
-
178
-
179
-
180
-
181
-
182
-
183
-
184
-
185
-
186
-
187
-
188
-
189
-
190
-
191
-
192
-
193
-
194
-
195
-
196
-
197
-
198
-
199
-
200
-
201
-
202
-
203
-
204
-
205
-
206
-
207
-
208
-
209
-
210
-
211
-
212
-
213
-
214
-
215
-
216
-
217
-
218
-
219
-
220
-
221
-
222
-
223
-
224
-
225
-
 226
226 -
 227
227 -
 228
228 -
 229
229 -
 230
230 -
 231
231 -
 232
232 -
 233
233 -
 234
234 -
 235
235 -
 236
236 -
 237
237 -
 238
238 -
 239
239 -
 240
240 -
 241
241 -
 242
242 -
 243
243 -
 244
244 -
 245
245 -
 246
246 -
247
-
248
-
249
-
250
-
251
-
252
-
253
-
254
-
255
-
256
-
257
-
258
-
259
-
260
-
261
-
262
 |
 |

235
RBS Group • Annual Report and Accounts 2006
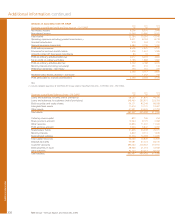
Additional information
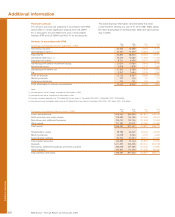
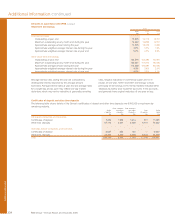
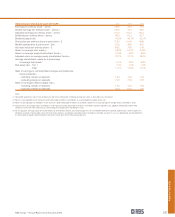
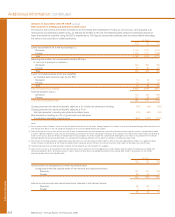
Amounts in accordance with US GAAP
2006 2006 2005 2004 2003 2002
$m(1) £m £m £m £m £m
Net income available for ordinary shareholders 10,655 5,440 4,475 3,909 2,564 3,108
Shareholders’ equity 78,495 40,077 40,229 36,191 31,665 28,177
Total assets 1,509,718 770,815 700,386 631,100 488,046 430,573
Other financial data based upon US GAAP 2006 2005 2004 2003 2002
Basic earnings per ordinary share – pence 170.8 140.6 126.7 87.5 107.9
Diluted earnings per ordinary share – pence (2) 169.7 140.0 125.9 86.8 106.3
Dividends per ordinary share – pence 77.3 60.6 52.5 45.6 39.7
Dividend payout ratio 45.4% 43.1% 40.6% 51.9% 36.7%
Return on average total assets (3) 0.73% 0.64% 0.70% 0.55% 0.75%
Return on average ordinary shareholders’ equity (4) 16.0% 13.4% 13.2% 9.5% 12.1%
Average shareholders’ equity as a percentage
of average total assets 5.3% 5.4% 6.3% 6.5% 7.3%
Ratio of earnings to combined fixed charges and preference
share dividends (5)
– including interest on deposits 1.53 1.55 1.73 1.98 1.97
– excluding interest on deposits 5.39 5.17 6.34 7.24 6.49
Ratio of earnings to combined fixed charges only (5)
– including interest on deposits 1.57 1.60 1.79 2.07 2.07
– excluding interest on deposits 6.55 6.56 8.28 9.96 9.03
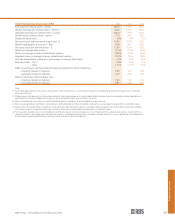
Notes:
(1) The dollar information included above has been converted from sterling at a rate of US$1.9586, the Noon Buying Rate on 29 December 2006.
(2) All convertible preference shares have a dilutive effect in 2006 and 2005 and as such have been included in the computation of diluted earnings per share. In prior years their
effect was anti-dilutive.
(3) Return on average total assets represents profit attributable to ordinary shareholders as a percentage of average total assets.
(4) Return on average ordinary shareholders’ equity represents profit attributable to ordinary shareholders expressed as a percentage of average ordinary shareholders’ equity.
(5) For this purpose, earnings consist of income before tax and minority interests, plus fixed charges less the unremitted income of associated undertakings (share of profits less
dividends received). Fixed charges consist of total interest expense, including or excluding interest on deposits and debt securities in issue, as appropriate, and the proportion
of rental expense deemed representative of the interest factor (one third of total rental expenses).