RBS 2006 Annual Report Download - page 79
Download and view the complete annual report
Please find page 79 of the 2006 RBS annual report below. You can navigate through the pages in the report by either clicking on the pages listed below, or by using the keyword search tool below to find specific information within the annual report.-
 1
1 -
2
-
3
-
4
-
5
-
6
-
7
-
8
-
9
-
10
-
11
-
12
-
13
-
14
-
15
-
16
-
17
-
18
-
19
-
20
-
21
-
22
-
23
-
24
-
25
-
26
-
27
-
28
-
29
-
30
-
31
-
32
-
33
-
34
-
35
-
36
-
37
-
38
-
39
-
40
-
41
-
42
-
43
-
44
-
45
-
46
-
47
-
48
-
49
-
50
-
51
-
52
-
53
-
54
-
55
-
56
-
57
-
58
-
59
-
60
-
61
-
62
-
63
-
64
-
65
-
66
-
67
-
68
-
 69
69 -
 70
70 -
 71
71 -
 72
72 -
 73
73 -
 74
74 -
 75
75 -
 76
76 -
 77
77 -
 78
78 -
 79
79 -
 80
80 -
 81
81 -
 82
82 -
 83
83 -
 84
84 -
 85
85 -
 86
86 -
 87
87 -
 88
88 -
 89
89 -
90
-
91
-
92
-
93
-
94
-
95
-
96
-
97
-
98
-
99
-
100
-
101
-
102
-
103
-
104
-
105
-
106
-
107
-
108
-
109
-
110
-
111
-
112
-
113
-
114
-
115
-
116
-
117
-
118
-
119
-
120
-
121
-
122
-
123
-
124
-
125
-
126
-
127
-
128
-
129
-
130
-
131
-
132
-
133
-
134
-
135
-
136
-
137
-
138
-
139
-
140
-
141
-
142
-
143
-
144
-
145
-
146
-
147
-
148
-
149
-
150
-
151
-
152
-
153
-
154
-
155
-
156
-
157
-
158
-
159
-
160
-
161
-
162
-
163
-
164
-
165
-
166
-
167
-
168
-
169
-
170
-
171
-
172
-
173
-
174
-
175
-
176
-
177
-
178
-
179
-
180
-
181
-
182
-
183
-
184
-
185
-
186
-
187
-
188
-
189
-
190
-
191
-
192
-
193
-
194
-
195
-
196
-
197
-
198
-
199
-
200
-
201
-
202
-
203
-
204
-
205
-
206
-
207
-
208
-
209
-
210
-
211
-
212
-
213
-
214
-
215
-
216
-
217
-
218
-
219
-
220
-
221
-
222
-
223
-
224
-
225
-
226
-
227
-
228
-
229
-
230
-
231
-
232
-
233
-
234
-
235
-
236
-
237
-
238
-
239
-
240
-
241
-
242
-
243
-
244
-
245
-
246
-
247
-
248
-
249
-
250
-
251
-
252
-
253
-
254
-
255
-
256
-
257
-
258
-
259
-
260
-
261
-
262
 |
 |

RBS Group • Annual Report and Accounts 2006
78
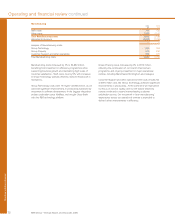
Operating and financial review continued
Operating and financial review
IFRS compared with US GAAP
The Group’s financial statements are prepared in accordance
with IFRS, which differ in certain material respects from US
GAAP as described on pages 214 to 224.
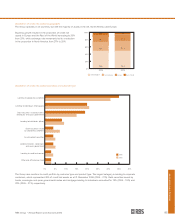
The net income available for ordinary shareholders under US
GAAP was £5,440 million; £762 million lower than profit
attributable to ordinary shareholders under IFRS of £6,202
million. The principal reasons for the decrease are:
•reversal of net revaluation gains of £470 million on
investment properties.
•reduction of £454 million from eliminating IFRS hedge
accounting adjustments partially offset by an increase of
£196 million relating to financial instruments, principally net
foreign exchange losses on available-for-sale securities.
•higher pension costs of £387 million under US GAAP
reflecting the deferral of actuarial losses over the remaining
service lives of current employees.
•tax of £410 million on the above and other adjustments.
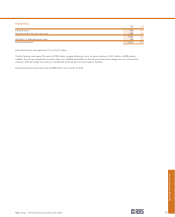
US GAAP shareholders’ equity at £40,077 million is £150
million lower than IFRS shareholders’ equity of £40,227 million
mainly attributable to the reversal of revaluation gains: £2,558
million on financial instruments, principally the Group’s
investment in Bank of China and £873 million on investment
and own-use properties, offset by the inclusion of £1,491
million of preference shares classified as debt under IFRS,
an increase of £520 million from the deferral and amortisation
of loan origination costs, net difference of £692 million on
acquisition accounting and intangibles and tax on these and
other adjustments of £784 million.
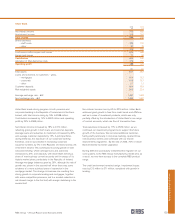
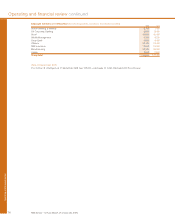
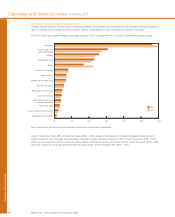
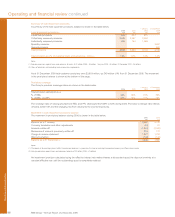
Capital resources
The following table analyses the Group’s regulatory capital resources at 31 December:
2006 2005 2004 2003 2002
£m £m £m £m £m
Capital base
Tier 1 capital 30,041 28,218 22,694 19,399 17,155
Tier 2 capital 27,491 22,437 20,229 16,439 13,271
57,532 50,655 42,923 35,838 30,426
Less: investments in insurance subsidiaries, associated
undertakings and other supervisory deductions (10,583) (7,282) (5,165) (4,618) (3,146)
Total capital 46,949 43,373 37,758 31,220 27,280
Risk-weighted assets
Banking book:
On-balance sheet 318,600 303,300 261,800 214,400 193,800
Off-balance sheet 59,400 51,500 44,900 36,400 28,700
Trading book 22,300 16,200 17,100 12,900 11,500
400,300 371,000 323,800 263,700 234,000
Risk asset ratios %%%%%
Tier 1 7.5 7.6 7.0 7.4 7.3
Total 11.7 11.7 11.7 11.8 11.7
Note: The comparative data for 2002 to 2004 in the table above are under UK GAAP as previously published and regulated.
As from 1 January 2005, the Group was regulated on an IFRS basis.
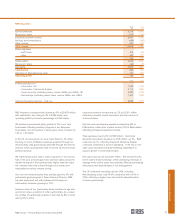
It is the Group’s policy to maintain a strong capital base, to
expand it as appropriate and to utilise it efficiently throughout
its activities to optimise the return to shareholders while
maintaining a prudent relationship between the capital base
and the underlying risks of the business. In carrying out this
policy, the Group has regard to the supervisory requirements
of the Financial Services Authority (“FSA”). The FSA uses Risk
Asset Ratio (“RAR”) as a measure of capital adequacy in the
UK banking sector, comparing a bank’s capital resources with
its risk-weighted assets (the assets and off-balance sheet
exposures are ‘weighted’ to reflect the inherent credit and
other risks); by international agreement, the RAR should be
not less than 8% with a tier 1 component of not less than 4%.
At 31 December 2006, the Group’s total RAR was 11.7%
(2005 – 11.7%) and the tier 1 RAR was 7.5% (2005 – 7.6%).