BB&T 2015 Annual Report Download - page 112
Download and view the complete annual report
Please find page 112 of the 2015 BB&T annual report below. You can navigate through the pages in the report by either clicking on the pages listed below, or by using the keyword search tool below to find specific information within the annual report.-
 1
1 -
2
-
3
-
4
-
5
-
6
-
7
-
8
-
9
-
10
-
11
-
12
-
13
-
14
-
15
-
16
-
17
-
18
-
19
-
20
-
21
-
22
-
23
-
24
-
25
-
26
-
27
-
28
-
29
-
30
-
31
-
32
-
33
-
34
-
35
-
36
-
37
-
38
-
39
-
40
-
41
-
42
-
43
-
44
-
45
-
46
-
47
-
48
-
49
-
50
-
51
-
52
-
53
-
54
-
55
-
56
-
57
-
58
-
59
-
60
-
61
-
62
-
63
-
64
-
65
-
66
-
67
-
68
-
69
-
70
-
71
-
72
-
73
-
74
-
75
-
76
-
77
-
78
-
79
-
80
-
81
-
82
-
83
-
84
-
85
-
86
-
87
-
88
-
89
-
90
-
91
-
92
-
93
-
94
-
95
-
96
-
97
-
98
-
99
-
100
-
101
-
 102
102 -
 103
103 -
 104
104 -
 105
105 -
 106
106 -
 107
107 -
 108
108 -
 109
109 -
 110
110 -
 111
111 -
 112
112 -
 113
113 -
 114
114 -
 115
115 -
 116
116 -
 117
117 -
 118
118 -
 119
119 -
 120
120 -
 121
121 -
 122
122 -
123
-
124
-
125
-
126
-
127
-
128
-
129
-
130
-
131
-
132
-
133
-
134
-
135
-
136
-
137
-
138
-
139
-
140
-
141
-
142
-
143
-
144
-
145
-
146
-
147
-
148
-
149
-
150
-
151
-
152
-
153
-
154
-
155
-
156
-
157
-
158
-
159
-
160
-
161
-
162
-
163
-
164
-
165
-
166
-
167
-
168
-
169
-
170
-
171
-
172
-
173
-
174
-
175
-
176
-
177
-
178
-
179
-
180
-
181
-
182
-
183
-
184
-
185
-
186
-
187
-
188
-
189
-
190
-
191
-
192
-
193
-
194
-
195
-
196
-
197
-
198
-
199
-
200
-
201
-
202
-
203
-
204
-
205
-
206
-
207
-
208
-
209
-
210
-
211
-
212
-
213
-
214
-
215
-
216
-
217
-
218
-
219
-
220
-
221
-
222
-
223
-
224
-
225
-
226
-
227
-
228
-
229
-
230
-
231
-
232
-
233
-
234
-
235
-
236
-
237
-
238
-
239
-
240
-
241
-
242
-
243
-
244
-
245
-
246
-
247
-
248
-
249
-
250
-
251
-
252
-
253
-
254
-
255
-
256
-
257
-
258
-
259
-
260
-
261
-
262
-
263
-
264
-
265
-
266
-
267
-
268
-
269
-
270
-
271
-
272
-
273
-
274
-
275
-
276
-
277
-
278
-
279
-
280
-
281
-
282
-
283
-
284
-
285
-
286
-
287
-
288
-
289
-
290
-
291
-
292
-
293
-
294
-
295
-
296
-
297
-
298
-
299
-
300
-
301
-
302
-
303
-
304
-
305
-
306
-
307
-
308
-
309
-
310
-
311
-
312
-
313
-
314
-
315
-
316
-
317
-
318
-
319
-
320
-
321
-
322
-
323
-
324
-
325
-
326
-
327
-
328
-
329
-
330
-
331
-
332
-
333
-
334
-
335
-
336
-
337
-
338
-
339
-
340
-
341
-
342
-
343
-
344
-
345
-
346
-
347
-
348
-
349
-
350
-
351
-
352
-
353
-
354
-
355
-
356
-
357
-
358
-
359
-
360
-
361
-
362
-
363
-
364
-
365
-
366
-
367
-
368
-
369
-
370
 |
 |

TableofContents
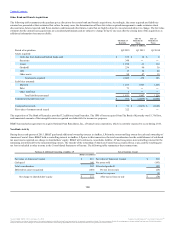
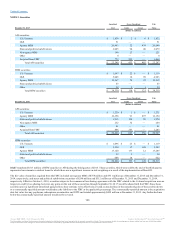
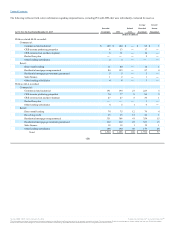
AFS securities:
U.S. Treasury $ 1,836 $ 2 $ 6 $ 1,832
GSE 51 — — 51
Agency MBS 20,463 22 439 20,046
States and political subdivisions 2,025 94 40 2,079
Non-agency MBS 198 23 — 221
Other 4 — — 4
Acquired from FDIC 772 292 — 1,064
Total AFS securities $ 25,349 $ 433 $ 485 $ 25,297
HTM securities:
U.S. Treasury $ 1,097 $ 22 $ — $ 1,119
GSE 5,045 16 98 4,963
Agency MBS 12,267 70 22 12,315
States and political subdivisions 63 — — 63
Other 58 2 1 59
Total HTM securities $ 18,530 $ 110 $ 121 $ 18,519
AFS securities:
U.S. Treasury $ 1,230 $ 1 $ — $ 1,231
Agency MBS 16,358 93 297 16,154
States and political subdivisions 1,913 120 59 1,974
Non-agency MBS 232 32 — 264
Other 41 — — 41
Acquired from FDIC 886 357 — 1,243
Total AFS securities $ 20,660 $ 603 $ 356 $ 20,907
HTM securities:
U.S. Treasury $ 1,096 $ 23 $ — $ 1,119
GSE 5,394 17 108 5,303
Agency MBS 13,120 137 12 13,245
States and political subdivisions 22 2 — 24
Other 608 14 — 622
Total HTM securities $ 20,240 $ 193 $ 120 $ 20,313
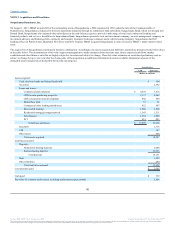
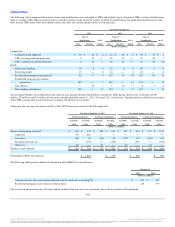
BB&T transferred $517 million of HTM securities to AFS during the third quarter of 2015. These securities, which were sold by the end of the third quarter,
represented investments in student loans for which there was a significant increase in risk weighting as a result of the implementation of Basel III.
The fair value of securities acquired from the FDIC included non-agency MBS of $768 million and $931 million as of December 31, 2015 and December 31,
2014, respectively, and states and political subdivisions securities of $296 million and $312 million as of December 31, 2015 and December 31, 2014,
respectively. Effective October 1, 2014, securities subject to the commercial loss sharing agreement with the FDIC related to the Colonial acquisition were no
longer covered by loss sharing; however, any gains on the sale of these securities through September 30, 2017 would be shared with the FDIC. Since these
securities are in a significant unrealized gain position, they continue to be effectively covered as any declines in the unrealized gains of the securities down
to a contractually specified amount would reduce the liability to the FDIC at the applicable percentage. The contractually-specified amount is the acquisition
date fair value less any paydowns, redemptions or maturities and OTTI and totaled approximately $492 million at December 31, 2015. Any further declines
below the contractually-specified amount would not be covered.
101
Source: BB&T CORP, 10-K, February 25, 2016 Powered by Morningstar® Document Research℠
The information contained herein may not be copied, adapted or distributed and is not warranted to be accurate, complete or timely. The user assumes all risks for any damages or losses arising from any use of this information,
except to the extent such damages or losses cannot be limited or excluded by applicable law. Past financial performance is no guarantee of future results.