BB&T 2015 Annual Report Download - page 76
Download and view the complete annual report
Please find page 76 of the 2015 BB&T annual report below. You can navigate through the pages in the report by either clicking on the pages listed below, or by using the keyword search tool below to find specific information within the annual report.-
 1
1 -
2
-
3
-
4
-
5
-
6
-
7
-
8
-
9
-
10
-
11
-
12
-
13
-
14
-
15
-
16
-
17
-
18
-
19
-
20
-
21
-
22
-
23
-
24
-
25
-
26
-
27
-
28
-
29
-
30
-
31
-
32
-
33
-
34
-
35
-
36
-
37
-
38
-
39
-
40
-
41
-
42
-
43
-
44
-
45
-
46
-
47
-
48
-
49
-
50
-
51
-
52
-
53
-
54
-
55
-
56
-
57
-
58
-
59
-
60
-
61
-
62
-
63
-
64
-
65
-
 66
66 -
 67
67 -
 68
68 -
 69
69 -
 70
70 -
 71
71 -
 72
72 -
 73
73 -
 74
74 -
 75
75 -
 76
76 -
 77
77 -
 78
78 -
 79
79 -
 80
80 -
 81
81 -
 82
82 -
 83
83 -
 84
84 -
 85
85 -
 86
86 -
87
-
88
-
89
-
90
-
91
-
92
-
93
-
94
-
95
-
96
-
97
-
98
-
99
-
100
-
101
-
102
-
103
-
104
-
105
-
106
-
107
-
108
-
109
-
110
-
111
-
112
-
113
-
114
-
115
-
116
-
117
-
118
-
119
-
120
-
121
-
122
-
123
-
124
-
125
-
126
-
127
-
128
-
129
-
130
-
131
-
132
-
133
-
134
-
135
-
136
-
137
-
138
-
139
-
140
-
141
-
142
-
143
-
144
-
145
-
146
-
147
-
148
-
149
-
150
-
151
-
152
-
153
-
154
-
155
-
156
-
157
-
158
-
159
-
160
-
161
-
162
-
163
-
164
-
165
-
166
-
167
-
168
-
169
-
170
-
171
-
172
-
173
-
174
-
175
-
176
-
177
-
178
-
179
-
180
-
181
-
182
-
183
-
184
-
185
-
186
-
187
-
188
-
189
-
190
-
191
-
192
-
193
-
194
-
195
-
196
-
197
-
198
-
199
-
200
-
201
-
202
-
203
-
204
-
205
-
206
-
207
-
208
-
209
-
210
-
211
-
212
-
213
-
214
-
215
-
216
-
217
-
218
-
219
-
220
-
221
-
222
-
223
-
224
-
225
-
226
-
227
-
228
-
229
-
230
-
231
-
232
-
233
-
234
-
235
-
236
-
237
-
238
-
239
-
240
-
241
-
242
-
243
-
244
-
245
-
246
-
247
-
248
-
249
-
250
-
251
-
252
-
253
-
254
-
255
-
256
-
257
-
258
-
259
-
260
-
261
-
262
-
263
-
264
-
265
-
266
-
267
-
268
-
269
-
270
-
271
-
272
-
273
-
274
-
275
-
276
-
277
-
278
-
279
-
280
-
281
-
282
-
283
-
284
-
285
-
286
-
287
-
288
-
289
-
290
-
291
-
292
-
293
-
294
-
295
-
296
-
297
-
298
-
299
-
300
-
301
-
302
-
303
-
304
-
305
-
306
-
307
-
308
-
309
-
310
-
311
-
312
-
313
-
314
-
315
-
316
-
317
-
318
-
319
-
320
-
321
-
322
-
323
-
324
-
325
-
326
-
327
-
328
-
329
-
330
-
331
-
332
-
333
-
334
-
335
-
336
-
337
-
338
-
339
-
340
-
341
-
342
-
343
-
344
-
345
-
346
-
347
-
348
-
349
-
350
-
351
-
352
-
353
-
354
-
355
-
356
-
357
-
358
-
359
-
360
-
361
-
362
-
363
-
364
-
365
-
366
-
367
-
368
-
369
-
370
 |
 |

TableofContents
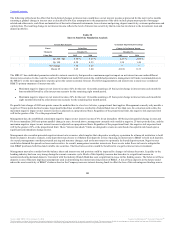
Beta represents the correlation between overall market interest rates and the rates paid by BB&T on interest-bearing deposits. BB&T applies an average beta
of approximately 80% to its managed rate deposits for determining its interest rate sensitivity. Managed rate deposits are high beta, premium money market
and interest checking accounts, which attract significant client funds when needed to support balance sheet growth. BB&T regularly conducts sensitivity on
other key variables to determine the impact they could have on the interest rate risk position. This allows BB&T to evaluate the likely impact on its balance
sheet management strategies due to a more extreme variation in a key assumption than expected.
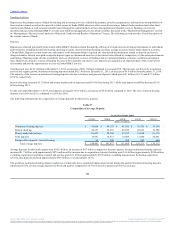
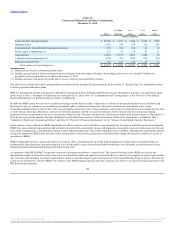
The following table shows the effect that the loss of demand deposits and an associated increase in managed rate deposits would have on BB&T’s interest-
rate sensitivity position. For purposes of this analysis, BB&T modeled the incremental beta for the replacement of the lost demand deposits at 100%.
Up 200 bps 2.23 % 2.01 % 1.12 %
Up 100 1.58 1.44 0.89
(1) The base scenario is equal to the annualized hypothetical percentage change in net interest income at December 31, 2015 as presented in the preceding
table.
If rates increased 200 basis points, BB&T could absorb the loss of $10.1 billion, or 22.0%, of noninterest-bearing demand deposits and replace them with
managed rate deposits with a beta of 100% before becoming neutral to interest rate changes.
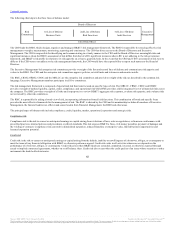
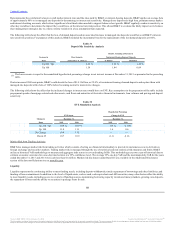
The following table shows the effect that the indicated changes in interest rates would have on EVE. Key assumptions in the preparation of the table include
prepayment speeds of mortgage-related and other assets, cash flows and maturities of derivative financial instruments, loan volumes and pricing and deposit
sensitivity.
Up 200 bps 10.9 % 10.9 % 0.6 % (1.5)%
Up 100 11.0 11.1 1.6 0.6
No Change 10.8 11.1 ― ―
Down 25 10.7 10.9 (1.1) (1.0)
Market Risk from Trading Activities
BB&T also manages market risk from trading activities which consists of acting as a financial intermediary to provide its customers access to derivatives,
foreign exchange and securities markets. Trading market risk is managed through the use of statistical and non-statistical risk measures and limits. BB&T
utilizes a historical VaR methodology to measure and aggregate risks across its covered trading LOBs. This methodology uses two years of historical data to
estimate economic outcomes for a one-day time horizon at a 99% confidence level. The average 99% one-day VaR and the maximum daily VaR for the years
ended December 31, 2015 and 2014 were each less than $1 million. Market risk disclosures under Basel II.5 are available in the Additional Disclosures
section of the Investor Relations site on www.bbt.com.
Liquidity
Liquidity represents the continuing ability to meet funding needs, including deposit withdrawals, timely repayment of borrowings and other liabilities, and
funding of loan commitments. In addition to the level of liquid assets, such as cash, cash equivalents and AFS securities, many other factors affect the ability
to meet liquidity needs, including access to a variety of funding sources, maintaining borrowing capacity in national money markets, growing core deposits,
the repayment of loans and the ability to securitize or package loans for sale.
69
Source: BB&T CORP, 10-K, February 25, 2016 Powered by Morningstar® Document Research℠
The information contained herein may not be copied, adapted or distributed and is not warranted to be accurate, complete or timely. The user assumes all risks for any damages or losses arising from any use of this information,
except to the extent such damages or losses cannot be limited or excluded by applicable law. Past financial performance is no guarantee of future results.