BB&T 2015 Annual Report Download - page 59
Download and view the complete annual report
Please find page 59 of the 2015 BB&T annual report below. You can navigate through the pages in the report by either clicking on the pages listed below, or by using the keyword search tool below to find specific information within the annual report.-
 1
1 -
2
-
3
-
4
-
5
-
6
-
7
-
8
-
9
-
10
-
11
-
12
-
13
-
14
-
15
-
16
-
17
-
18
-
19
-
20
-
21
-
22
-
23
-
24
-
25
-
26
-
27
-
28
-
29
-
30
-
31
-
32
-
33
-
34
-
35
-
36
-
37
-
38
-
39
-
40
-
41
-
42
-
43
-
44
-
45
-
46
-
47
-
48
-
 49
49 -
 50
50 -
 51
51 -
 52
52 -
 53
53 -
 54
54 -
 55
55 -
 56
56 -
 57
57 -
 58
58 -
 59
59 -
 60
60 -
 61
61 -
 62
62 -
 63
63 -
 64
64 -
 65
65 -
 66
66 -
 67
67 -
 68
68 -
 69
69 -
70
-
71
-
72
-
73
-
74
-
75
-
76
-
77
-
78
-
79
-
80
-
81
-
82
-
83
-
84
-
85
-
86
-
87
-
88
-
89
-
90
-
91
-
92
-
93
-
94
-
95
-
96
-
97
-
98
-
99
-
100
-
101
-
102
-
103
-
104
-
105
-
106
-
107
-
108
-
109
-
110
-
111
-
112
-
113
-
114
-
115
-
116
-
117
-
118
-
119
-
120
-
121
-
122
-
123
-
124
-
125
-
126
-
127
-
128
-
129
-
130
-
131
-
132
-
133
-
134
-
135
-
136
-
137
-
138
-
139
-
140
-
141
-
142
-
143
-
144
-
145
-
146
-
147
-
148
-
149
-
150
-
151
-
152
-
153
-
154
-
155
-
156
-
157
-
158
-
159
-
160
-
161
-
162
-
163
-
164
-
165
-
166
-
167
-
168
-
169
-
170
-
171
-
172
-
173
-
174
-
175
-
176
-
177
-
178
-
179
-
180
-
181
-
182
-
183
-
184
-
185
-
186
-
187
-
188
-
189
-
190
-
191
-
192
-
193
-
194
-
195
-
196
-
197
-
198
-
199
-
200
-
201
-
202
-
203
-
204
-
205
-
206
-
207
-
208
-
209
-
210
-
211
-
212
-
213
-
214
-
215
-
216
-
217
-
218
-
219
-
220
-
221
-
222
-
223
-
224
-
225
-
226
-
227
-
228
-
229
-
230
-
231
-
232
-
233
-
234
-
235
-
236
-
237
-
238
-
239
-
240
-
241
-
242
-
243
-
244
-
245
-
246
-
247
-
248
-
249
-
250
-
251
-
252
-
253
-
254
-
255
-
256
-
257
-
258
-
259
-
260
-
261
-
262
-
263
-
264
-
265
-
266
-
267
-
268
-
269
-
270
-
271
-
272
-
273
-
274
-
275
-
276
-
277
-
278
-
279
-
280
-
281
-
282
-
283
-
284
-
285
-
286
-
287
-
288
-
289
-
290
-
291
-
292
-
293
-
294
-
295
-
296
-
297
-
298
-
299
-
300
-
301
-
302
-
303
-
304
-
305
-
306
-
307
-
308
-
309
-
310
-
311
-
312
-
313
-
314
-
315
-
316
-
317
-
318
-
319
-
320
-
321
-
322
-
323
-
324
-
325
-
326
-
327
-
328
-
329
-
330
-
331
-
332
-
333
-
334
-
335
-
336
-
337
-
338
-
339
-
340
-
341
-
342
-
343
-
344
-
345
-
346
-
347
-
348
-
349
-
350
-
351
-
352
-
353
-
354
-
355
-
356
-
357
-
358
-
359
-
360
-
361
-
362
-
363
-
364
-
365
-
366
-
367
-
368
-
369
-
370
 |
 |

TableofContents
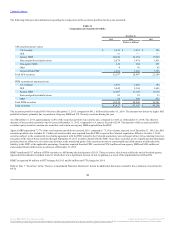
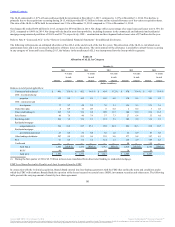
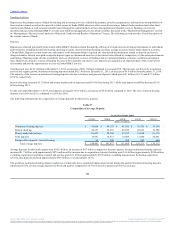
Loans 90 days or more past due and still accruing interest, excluding government guaranteed GNMA mortgage loans, totaled $312 million at December 31,
2015, compared with $535 million at year-end 2014, a decline of $223 million. This reduction reflects overall continued improvement in credit quality.
Loans 30-89 days past due, excluding government guaranteed GNMA mortgage loans, totaled $1.0 billion at December 31, 2015, an increase of $132 million
compared to the prior year, primarily due to higher loan balances.
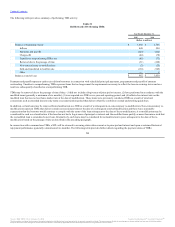
Asset Quality Ratios (including PCI)
Loans 30 - 89 days past due and still accruing as a
percentage of loans and leases HFI (1) 0.76 % 0.75 % 0.95 % 1.10 % 1.30 %
Loans 90 days or more past due and still accruing as a
percentage of loans and leases HFI (1) 0.23 0.45 0.62 0.75 1.06
NPLs as a percentage of loans and leases HFI 0.42 0.51 0.81 1.20 1.74
NPAs as a percentage of:
Total assets 0.34 0.42 0.64 0.97 1.62
Loans and leases HFI plus foreclosed property 0.52 0.65 1.01 1.56 2.63
Net charge-offs as a percentage of average loans
and leases HFI (2) 0.35 0.46 0.69 1.17 1.60
ALLL as a percentage of loans and leases HFI 1.07 1.23 1.49 1.76 2.10
Ratio of ALLL to:
Net charge-offs (2) 3.36 x 2.74 x 2.19 x 1.56 x 1.36 x
NPLs 2.53 2.39 1.85 1.46 1.21
Asset Quality Ratios (excluding PCI)(3)
Loans 90 days or more past due and still accruing as a
percentage of loans and leases HFI (1) 0.15 % 0.29 % 0.37 % 0.38 % 0.39 %
(1) Excludes government guaranteed GNMA mortgage loans that BB&T has the right but not the obligation to repurchase. Refer to the footnotes of Table
19 for amounts related to these loans.
(2) Net charge-offs for 2011 include $236 million related to BB&T’s NPA disposition strategy. In connection with this strategy, approximately $271 million
of problem loans were transferred from loans HFI to LHFS in 2011. The disposition of all such loans was complete as of December 31, 2011.
(3) These asset quality ratios have been adjusted to remove the impact of PCI assets. Appropriate adjustments to the numerator and denominator have been
reflected in the calculation of these ratios.
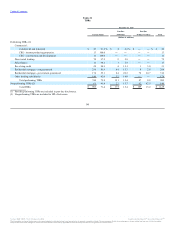
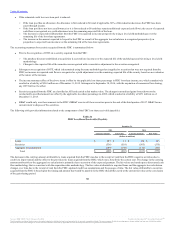
Potential problem loans include loans on nonaccrual status or past due as disclosed in Table 19. In addition, for the commercial portfolio segment, loans that
are rated special mention or substandard performing are closely monitored by management as potential problem loans. Refer to Note 4 “Loans and ACL” in
the “Notes to Consolidated Financial Statements” herein for additional disclosures related to these potential problem loans.
TDRs generally occur when a borrower is experiencing, or is expected to experience, financial difficulties in the near-term. As a result, BB&T will work with
the borrower to prevent further difficulties, and ultimately to improve the likelihood of recovery on the loan. To facilitate this process, a concessionary
modification that would not otherwise be considered may be granted, resulting in classification of the loan as a TDR. Refer to Note 1 “Summary of
Significant Accounting Policies” in the “Notes to Consolidated Financial Statements” for additional policy information regarding TDRs.
BB&T’s performing TDRs, excluding government guaranteed GNMA mortgage loans, totaled $982 million at December 31, 2015, a reduction of $68 million
compared to the prior year. This decline reflects lower performing TDR balances across most loan portfolios.
52
Source: BB&T CORP, 10-K, February 25, 2016 Powered by Morningstar® Document Research℠
The information contained herein may not be copied, adapted or distributed and is not warranted to be accurate, complete or timely. The user assumes all risks for any damages or losses arising from any use of this information,
except to the extent such damages or losses cannot be limited or excluded by applicable law. Past financial performance is no guarantee of future results.