BB&T 2015 Annual Report Download - page 96
Download and view the complete annual report
Please find page 96 of the 2015 BB&T annual report below. You can navigate through the pages in the report by either clicking on the pages listed below, or by using the keyword search tool below to find specific information within the annual report.-
 1
1 -
2
-
3
-
4
-
5
-
6
-
7
-
8
-
9
-
10
-
11
-
12
-
13
-
14
-
15
-
16
-
17
-
18
-
19
-
20
-
21
-
22
-
23
-
24
-
25
-
26
-
27
-
28
-
29
-
30
-
31
-
32
-
33
-
34
-
35
-
36
-
37
-
38
-
39
-
40
-
41
-
42
-
43
-
44
-
45
-
46
-
47
-
48
-
49
-
50
-
51
-
52
-
53
-
54
-
55
-
56
-
57
-
58
-
59
-
60
-
61
-
62
-
63
-
64
-
65
-
66
-
67
-
68
-
69
-
70
-
71
-
72
-
73
-
74
-
75
-
76
-
77
-
78
-
79
-
80
-
81
-
82
-
83
-
84
-
85
-
 86
86 -
 87
87 -
 88
88 -
 89
89 -
 90
90 -
 91
91 -
 92
92 -
 93
93 -
 94
94 -
 95
95 -
 96
96 -
 97
97 -
 98
98 -
 99
99 -
 100
100 -
 101
101 -
 102
102 -
 103
103 -
 104
104 -
 105
105 -
 106
106 -
107
-
108
-
109
-
110
-
111
-
112
-
113
-
114
-
115
-
116
-
117
-
118
-
119
-
120
-
121
-
122
-
123
-
124
-
125
-
126
-
127
-
128
-
129
-
130
-
131
-
132
-
133
-
134
-
135
-
136
-
137
-
138
-
139
-
140
-
141
-
142
-
143
-
144
-
145
-
146
-
147
-
148
-
149
-
150
-
151
-
152
-
153
-
154
-
155
-
156
-
157
-
158
-
159
-
160
-
161
-
162
-
163
-
164
-
165
-
166
-
167
-
168
-
169
-
170
-
171
-
172
-
173
-
174
-
175
-
176
-
177
-
178
-
179
-
180
-
181
-
182
-
183
-
184
-
185
-
186
-
187
-
188
-
189
-
190
-
191
-
192
-
193
-
194
-
195
-
196
-
197
-
198
-
199
-
200
-
201
-
202
-
203
-
204
-
205
-
206
-
207
-
208
-
209
-
210
-
211
-
212
-
213
-
214
-
215
-
216
-
217
-
218
-
219
-
220
-
221
-
222
-
223
-
224
-
225
-
226
-
227
-
228
-
229
-
230
-
231
-
232
-
233
-
234
-
235
-
236
-
237
-
238
-
239
-
240
-
241
-
242
-
243
-
244
-
245
-
246
-
247
-
248
-
249
-
250
-
251
-
252
-
253
-
254
-
255
-
256
-
257
-
258
-
259
-
260
-
261
-
262
-
263
-
264
-
265
-
266
-
267
-
268
-
269
-
270
-
271
-
272
-
273
-
274
-
275
-
276
-
277
-
278
-
279
-
280
-
281
-
282
-
283
-
284
-
285
-
286
-
287
-
288
-
289
-
290
-
291
-
292
-
293
-
294
-
295
-
296
-
297
-
298
-
299
-
300
-
301
-
302
-
303
-
304
-
305
-
306
-
307
-
308
-
309
-
310
-
311
-
312
-
313
-
314
-
315
-
316
-
317
-
318
-
319
-
320
-
321
-
322
-
323
-
324
-
325
-
326
-
327
-
328
-
329
-
330
-
331
-
332
-
333
-
334
-
335
-
336
-
337
-
338
-
339
-
340
-
341
-
342
-
343
-
344
-
345
-
346
-
347
-
348
-
349
-
350
-
351
-
352
-
353
-
354
-
355
-
356
-
357
-
358
-
359
-
360
-
361
-
362
-
363
-
364
-
365
-
366
-
367
-
368
-
369
-
370
 |
 |

TableofContents
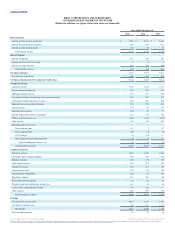
Net income $ 2,123 $ 2,206 $ 1,730
Adjustments to reconcile net income to net cash from operating activities:
Provision for credit losses 428 251 592
Adjustment to income tax provision (107) (39) 516
Depreciation 356 333 315
Loss on early extinguishment of debt 172 122 ―
Amortization of intangibles 105 91 106
Deferred tax expense 110 134 307
Equity-based compensation 106 102 96
(Gain) loss on securities, net 3 3 (51)
Net change in operating assets and liabilities:
LHFS 422 (201) 2,445
Trading securities (698) (101) 116
Other assets (493) 346 (75)
Accounts payable and other liabilities 263 (4) (812)
Other, net 125 (33) 23
Net cash from operating activities 2,915 3,210 5,308
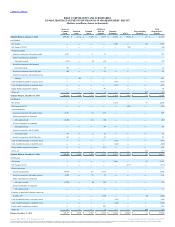
Proceeds from sales of AFS securities 6,302 1,309 2,209
Proceeds from maturities, calls and paydowns of AFS securities 5,064 3,915 6,214
Purchases of AFS securities (12,698) (3,685) (6,463)
Proceeds from maturities, calls and paydowns of HTM securities 3,791 1,866 2,863
Purchases of HTM securities (2,557) (4,030) (7,399)
Originations and purchases of loans and leases, net of principal collected (2,984) (5,041) (3,077)
Net cash from acquisitions and divestitures 1,055 1,025 516
Proceeds from sales of foreclosed property 218 239 394
Other, net 171 387 534
Net cash from investing activities (1,638) (4,015) (4,209)
Net change in deposits 2,506 337 (5,600)
Net change in short-term borrowings (982) (421) 1,274
Proceeds from issuance of long-term debt 2,272 5,510 4,164
Repayment of long-term debt (2,433) (3,912) (1,634)
Net proceeds from preferred stock issued ― ― 487
Cash dividends paid on common stock (789) (666) (765)
Cash dividends paid on preferred stock (148) (148) (147)
Other, net (317) 265 248
Net cash from financing activities 109 965 (1,973)
1,386 160 (874)
2,325 2,165 3,039
$ 3,711 $ 2,325 $ 2,165
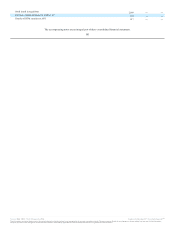
Cash paid during the period for:
Interest $ 734 $ 765 $ 918
Income taxes 655 322 677
Noncash investing and financing activities:
Transfers of loans to foreclosed assets 532 547 609
Transfers of loans HFI to LHFS 43 684 ―
Source: BB&T CORP, 10-K, February 25, 2016 Powered by Morningstar® Document Research℠
The information contained herein may not be copied, adapted or distributed and is not warranted to be accurate, complete or timely. The user assumes all risks for any damages or losses arising from any use of this information,
except to the extent such damages or losses cannot be limited or excluded by applicable law. Past financial performance is no guarantee of future results.