BB&T 2015 Annual Report Download - page 38
Download and view the complete annual report
Please find page 38 of the 2015 BB&T annual report below. You can navigate through the pages in the report by either clicking on the pages listed below, or by using the keyword search tool below to find specific information within the annual report.-
 1
1 -
2
-
3
-
4
-
5
-
6
-
7
-
8
-
9
-
10
-
11
-
12
-
13
-
14
-
15
-
16
-
17
-
18
-
19
-
20
-
21
-
22
-
23
-
24
-
25
-
26
-
27
-
 28
28 -
 29
29 -
 30
30 -
 31
31 -
 32
32 -
 33
33 -
 34
34 -
 35
35 -
 36
36 -
 37
37 -
 38
38 -
 39
39 -
 40
40 -
 41
41 -
 42
42 -
 43
43 -
 44
44 -
 45
45 -
 46
46 -
 47
47 -
 48
48 -
49
-
50
-
51
-
52
-
53
-
54
-
55
-
56
-
57
-
58
-
59
-
60
-
61
-
62
-
63
-
64
-
65
-
66
-
67
-
68
-
69
-
70
-
71
-
72
-
73
-
74
-
75
-
76
-
77
-
78
-
79
-
80
-
81
-
82
-
83
-
84
-
85
-
86
-
87
-
88
-
89
-
90
-
91
-
92
-
93
-
94
-
95
-
96
-
97
-
98
-
99
-
100
-
101
-
102
-
103
-
104
-
105
-
106
-
107
-
108
-
109
-
110
-
111
-
112
-
113
-
114
-
115
-
116
-
117
-
118
-
119
-
120
-
121
-
122
-
123
-
124
-
125
-
126
-
127
-
128
-
129
-
130
-
131
-
132
-
133
-
134
-
135
-
136
-
137
-
138
-
139
-
140
-
141
-
142
-
143
-
144
-
145
-
146
-
147
-
148
-
149
-
150
-
151
-
152
-
153
-
154
-
155
-
156
-
157
-
158
-
159
-
160
-
161
-
162
-
163
-
164
-
165
-
166
-
167
-
168
-
169
-
170
-
171
-
172
-
173
-
174
-
175
-
176
-
177
-
178
-
179
-
180
-
181
-
182
-
183
-
184
-
185
-
186
-
187
-
188
-
189
-
190
-
191
-
192
-
193
-
194
-
195
-
196
-
197
-
198
-
199
-
200
-
201
-
202
-
203
-
204
-
205
-
206
-
207
-
208
-
209
-
210
-
211
-
212
-
213
-
214
-
215
-
216
-
217
-
218
-
219
-
220
-
221
-
222
-
223
-
224
-
225
-
226
-
227
-
228
-
229
-
230
-
231
-
232
-
233
-
234
-
235
-
236
-
237
-
238
-
239
-
240
-
241
-
242
-
243
-
244
-
245
-
246
-
247
-
248
-
249
-
250
-
251
-
252
-
253
-
254
-
255
-
256
-
257
-
258
-
259
-
260
-
261
-
262
-
263
-
264
-
265
-
266
-
267
-
268
-
269
-
270
-
271
-
272
-
273
-
274
-
275
-
276
-
277
-
278
-
279
-
280
-
281
-
282
-
283
-
284
-
285
-
286
-
287
-
288
-
289
-
290
-
291
-
292
-
293
-
294
-
295
-
296
-
297
-
298
-
299
-
300
-
301
-
302
-
303
-
304
-
305
-
306
-
307
-
308
-
309
-
310
-
311
-
312
-
313
-
314
-
315
-
316
-
317
-
318
-
319
-
320
-
321
-
322
-
323
-
324
-
325
-
326
-
327
-
328
-
329
-
330
-
331
-
332
-
333
-
334
-
335
-
336
-
337
-
338
-
339
-
340
-
341
-
342
-
343
-
344
-
345
-
346
-
347
-
348
-
349
-
350
-
351
-
352
-
353
-
354
-
355
-
356
-
357
-
358
-
359
-
360
-
361
-
362
-
363
-
364
-
365
-
366
-
367
-
368
-
369
-
370
 |
 |
TableofContents
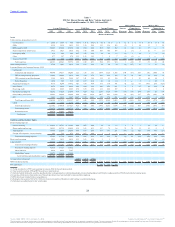
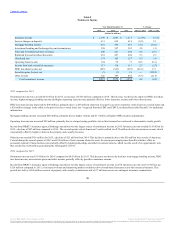
Total securities, at amortized cost: (2)
U.S. Treasuries $ 2,650 $ 1,969 $ 486 1.58 % 1.51 % 0.42 % $ 42 $ 30 $ 2 $ 12 $ 1 $ 11 $ 28 $ 13 $ 15
GSEs 5,338 5,516 5,032 2.13 2.10 2.04 113 116 103 (3) 2 (5) 13 3 10
MBS issued by GSE 30,683 29,504 27,598 1.98 2.00 2.00 605 589 552 16 (6) 22 37 ― 37
States and political subdivisions 1,913 1,827 1,836 5.62 5.78 5.80 108 106 107 2 (3) 5 (1) ― (1)
Non-agency MBS 215 246 283 8.17 7.55 5.69 18 19 16 (1) 1 (2) 3 5 (2)
Other 477 547 470 1.31 1.43 1.45 7 8 7 (1) (1) ― 1 ― 1
Acquired from FDIC 827 932 1,067 12.22 13.35 12.82 101 125 137 (24) (10) (14) (12) 5 (17)
Total securities 42,103 40,541 36,772 2.36 2.45 2.51 994 993 924 1 (16) 17 69 26 43
Other earning assets (3) 2,768 1,881 2,412 1.39 2.13 1.39 38 40 34 (2) (17) 15 6 15 (9)
Loans and leases, net of unearned income: (4)(5)
Commercial:
Commercial and industrial 44,648 39,537 38,206 3.21 3.35 3.63 1,434 1,325 1,386 109 (57) 166 (61) (108) 47
CRE-income producing properties 11,806 10,489 9,916 3.66 3.49 3.72 432 366 368 66 18 48 (2) (23) 21
CRE-construction and development 3,196 2,616 2,589 3.57 3.51 3.86 114 92 100 22 2 20 (8) (9) 1
Dealer floor plan 1,068 985 619 1.85 1.87 2.18 20 18 14 2 ― 2 4 (2) 6
Direct retail lending (6) 9,375 8,249 15,952 4.07 4.10 4.64 381 338 741 43 (2) 45 (403) (78) (325)
Sales finance 9,975 9,022 8,039 2.86 2.80 3.26 286 253 261 33 6 27 (8) (38) 30
Revolving credit 2,406 2,385 2,303 8.76 8.70 8.56 211 208 197 3 1 2 11 3 8
Residential mortgage (6) 30,252 31,528 23,598 4.15 4.20 4.22 1,255 1,325 996 (70) (16) (54) 329 (5) 334
Other lending subsidiaries 12,291 10,848 10,468 8.68 9.08 10.20 1,067 985 1,068 82 (45) 127 (83) (121) 38
PCI 1,083 1,613 2,667 16.57 17.22 16.93 179 278 451 (99) (10) (89) (173) 8 (181)
Total loans and leases HFI 126,100 117,272 114,357 4.27 4.42 4.88 5,379 5,188 5,582 191 (103) 294 (394) (373) (21)
LHFS 1,702 1,558 3,170 3.63 4.19 3.59 62 65 114 (3) (9) 6 (49) 17 (66)
Total loans and leases 127,802 118,830 117,527 4.26 4.42 4.85 5,441 5,253 5,696 188 (112) 300 (443) (356) (87)
Total earning assets 172,673 161,252 156,711 3.75 3.90 4.25 6,473 6,286 6,654 187 (145) 332 (368) (315) (53)
Nonearning assets 24,674 23,843 24,571
Total assets $ 197,347 $ 185,095 $ 181,282
Interest-bearing deposits:
Interest checking $ 22,092 $ 18,731 $ 19,305 0.08 0.07 0.08 18 13 15 5 2 3 (2) (2) ―
Money market and savings 56,592 49,728 48,640 0.19 0.15 0.13 107 74 64 33 22 11 10 9 1
Time deposits 16,405 22,569 26,006 0.66 0.67 0.85 107 151 221 (44) (2) (42) (70) (43) (27)
Foreign office deposits - interest-bearing 593 722 672 0.12 0.07 0.08 1 1 1 ― ― ― ― ― ―
Total interest-bearing deposits 95,682 91,750 94,623 0.24 0.26 0.32 233 239 301 (6) 22 (28) (62) (36) (26)
Short-term borrowings 3,221 3,421 4,459 0.15 0.13 0.16 5 5 7 ― ― ― (2) (1) (1)
Long-term debt 23,343 22,210 19,301 2.13 2.36 3.03 497 525 584 (28) (54) 26 (59) (139) 80
Total interest-bearing liabilities 122,246 117,381 118,383 0.60 0.65 0.75 735 769 892 (34) (32) (2) (123) (176) 53
Noninterest-bearing deposits 42,816 37,327 33,932
Other liabilities 6,414 6,433 7,107
Shareholders’ equity 25,871 23,954 21,860
Total liabilities and shareholders’ equity $ 197,347 $ 185,095 $ 181,282
Average interest rate spread 3.15 % 3.25 % 3.50 %
NIM / net interest income 3.32 % 3.42 % 3.68 % $ 5,738 $ 5,517 $ 5,762 $ 221 $ (113) $ 334 $ (245) $ (139) $ (106)
FTE adjustment $ 146 $ 143 $ 149
(1) Yields are stated on a FTE basis assuming tax rates in effect for the periods presented.
(2) Total securities include AFS and HTM securities at amortized cost.
(3) Includes Federal funds sold, securities purchased under resale agreements or similar arrangements, interest-bearing deposits with banks, trading securities, FHLB stock and other earning assets.
(4) Loan fees, which are not material for any of the periods shown, have been included for rate calculation purposes.
(5) NPLs have been included in the average balances.
(6) During the first quarter of 2014, $8.3 billion in loans were transferred from direct retail lending to residential mortgage.
(7) Excludes basis adjustments for fair value hedges.
33
Source: BB&T CORP, 10-K, February 25, 2016 Powered by Morningstar® Document Research℠
The information contained herein may not be copied, adapted or distributed and is not warranted to be accurate, complete or timely. The user assumes all risks for any damages or losses arising from any use of this information,
except to the extent such damages or losses cannot be limited or excluded by applicable law. Past financial performance is no guarantee of future results.