BB&T 2015 Annual Report Download - page 146
Download and view the complete annual report
Please find page 146 of the 2015 BB&T annual report below. You can navigate through the pages in the report by either clicking on the pages listed below, or by using the keyword search tool below to find specific information within the annual report.-
 1
1 -
2
-
3
-
4
-
5
-
6
-
7
-
8
-
9
-
10
-
11
-
12
-
13
-
14
-
15
-
16
-
17
-
18
-
19
-
20
-
21
-
22
-
23
-
24
-
25
-
26
-
27
-
28
-
29
-
30
-
31
-
32
-
33
-
34
-
35
-
36
-
37
-
38
-
39
-
40
-
41
-
42
-
43
-
44
-
45
-
46
-
47
-
48
-
49
-
50
-
51
-
52
-
53
-
54
-
55
-
56
-
57
-
58
-
59
-
60
-
61
-
62
-
63
-
64
-
65
-
66
-
67
-
68
-
69
-
70
-
71
-
72
-
73
-
74
-
75
-
76
-
77
-
78
-
79
-
80
-
81
-
82
-
83
-
84
-
85
-
86
-
87
-
88
-
89
-
90
-
91
-
92
-
93
-
94
-
95
-
96
-
97
-
98
-
99
-
100
-
101
-
102
-
103
-
104
-
105
-
106
-
107
-
108
-
109
-
110
-
111
-
112
-
113
-
114
-
115
-
116
-
117
-
118
-
119
-
120
-
121
-
122
-
123
-
124
-
125
-
126
-
127
-
128
-
129
-
130
-
131
-
132
-
133
-
134
-
135
-
 136
136 -
 137
137 -
 138
138 -
 139
139 -
 140
140 -
 141
141 -
 142
142 -
 143
143 -
 144
144 -
 145
145 -
 146
146 -
 147
147 -
 148
148 -
 149
149 -
 150
150 -
 151
151 -
 152
152 -
 153
153 -
 154
154 -
 155
155 -
 156
156 -
157
-
158
-
159
-
160
-
161
-
162
-
163
-
164
-
165
-
166
-
167
-
168
-
169
-
170
-
171
-
172
-
173
-
174
-
175
-
176
-
177
-
178
-
179
-
180
-
181
-
182
-
183
-
184
-
185
-
186
-
187
-
188
-
189
-
190
-
191
-
192
-
193
-
194
-
195
-
196
-
197
-
198
-
199
-
200
-
201
-
202
-
203
-
204
-
205
-
206
-
207
-
208
-
209
-
210
-
211
-
212
-
213
-
214
-
215
-
216
-
217
-
218
-
219
-
220
-
221
-
222
-
223
-
224
-
225
-
226
-
227
-
228
-
229
-
230
-
231
-
232
-
233
-
234
-
235
-
236
-
237
-
238
-
239
-
240
-
241
-
242
-
243
-
244
-
245
-
246
-
247
-
248
-
249
-
250
-
251
-
252
-
253
-
254
-
255
-
256
-
257
-
258
-
259
-
260
-
261
-
262
-
263
-
264
-
265
-
266
-
267
-
268
-
269
-
270
-
271
-
272
-
273
-
274
-
275
-
276
-
277
-
278
-
279
-
280
-
281
-
282
-
283
-
284
-
285
-
286
-
287
-
288
-
289
-
290
-
291
-
292
-
293
-
294
-
295
-
296
-
297
-
298
-
299
-
300
-
301
-
302
-
303
-
304
-
305
-
306
-
307
-
308
-
309
-
310
-
311
-
312
-
313
-
314
-
315
-
316
-
317
-
318
-
319
-
320
-
321
-
322
-
323
-
324
-
325
-
326
-
327
-
328
-
329
-
330
-
331
-
332
-
333
-
334
-
335
-
336
-
337
-
338
-
339
-
340
-
341
-
342
-
343
-
344
-
345
-
346
-
347
-
348
-
349
-
350
-
351
-
352
-
353
-
354
-
355
-
356
-
357
-
358
-
359
-
360
-
361
-
362
-
363
-
364
-
365
-
366
-
367
-
368
-
369
-
370
 |
 |

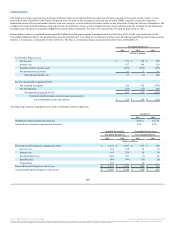
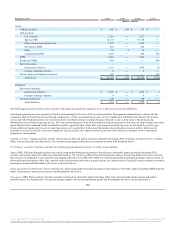
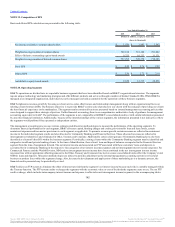
Assets:
Trading securities $ 482 $ 289 $ 193 $ ―
AFS securities:
U.S. Treasury 1,231 ― 1,231 ―
Agency MBS 16,154 ― 16,154 ―
States and political subdivisions 1,974 ― 1,974 ―
Non-agency MBS 264 ― 264 ―
Other 41 6 35 ―
Acquired from FDIC 1,243 ― 498 745
LHFS 1,423 ― 1,423 ―
Residential MSRs 844 ― ― 844
Derivative assets:
Interest rate contracts 1,114 ― 1,094 20
Foreign exchange contracts 8 ― 8 ―
Private equity and similar investments 329 ― ― 329
Total assets $ 25,107 $ 295 $ 22,874 $ 1,938
Liabilities:
Derivative liabilities:
Interest rate contracts $ 1,007 $ ― $ 1,004 $ 3
Foreign exchange contracts 6 ― 6 ―
Securities sold short 148 ― 148 ―
Total liabilities $ 1,161 $ ― $ 1,158 $ 3
The following discussion focuses on the valuation techniques and significant inputs for Level 2 and Level 3 assets and liabilities.
A third-party pricing service is generally utilized in determining the fair value of the securities portfolio. Management independently evaluates the fair
values provided by the pricing service through comparisons to other external pricing sources, review of additional information provided by the pricing
service and other third party sources for selected securities and back-testing to compare the price realized on any security sales to the daily pricing
information received from the pricing service. Fair value measurements are derived from market-based pricing matrices that were developed using observable
inputs that include benchmark yields, benchmark securities, reported trades, offers, bids, issuer spreads and broker quotes. As described by security type
below, additional inputs may be used, or some inputs may not be applicable. In the event that market observable data was not available, which would
generally occur due to the lack of an active market for a given security, the valuation of the security would be subjective and may involve substantial
judgment by management.
Trading securities: Trading securities include various types of debt and equity securities, primarily consisting of debt securities issued by the U.S. Treasury,
GSEs, or states and political subdivisions. The valuation techniques used for these investments are more fully discussed below.
U.S. Treasury securities: Treasury securities are valued using quoted prices in active over the counter markets.
Agency MBS: GSE pass-through securities are valued using market-based pricing matrices that reference observable inputs including benchmark TBA
security pricing and yield curves that were estimated based on U.S. Treasury yields and certain floating rate indices. The pricing matrices for these securities
may also give consideration to pool-specific data supplied directly by the GSE. GSE CMOs are valued using market-based pricing matrices that are based on
observable inputs including offers, bids, reported trades, dealer quotes and market research reports, the characteristics of a specific tranche, market convention
prepayment speeds and benchmark yield curves as described above.
States and political subdivisions: These securities are valued using market-based pricing matrices that reference observable inputs including MSRB reported
trades, issuer spreads, material event notices and benchmark yield curves.
Non-agency MBS: Pricing matrices for these securities are based on observable inputs including offers, bids, reported trades, dealer quotes and market
research reports, the characteristics of a specific tranche, market convention prepayment speeds and benchmark yield curves as described above.
133
Source: BB&T CORP, 10-K, February 25, 2016 Powered by Morningstar® Document Research℠
The information contained herein may not be copied, adapted or distributed and is not warranted to be accurate, complete or timely. The user assumes all risks for any damages or losses arising from any use of this information,
except to the extent such damages or losses cannot be limited or excluded by applicable law. Past financial performance is no guarantee of future results.