BB&T 2015 Annual Report Download - page 37
Download and view the complete annual report
Please find page 37 of the 2015 BB&T annual report below. You can navigate through the pages in the report by either clicking on the pages listed below, or by using the keyword search tool below to find specific information within the annual report.-
 1
1 -
2
-
3
-
4
-
5
-
6
-
7
-
8
-
9
-
10
-
11
-
12
-
13
-
14
-
15
-
16
-
17
-
18
-
19
-
20
-
21
-
22
-
23
-
24
-
25
-
26
-
 27
27 -
 28
28 -
 29
29 -
 30
30 -
 31
31 -
 32
32 -
 33
33 -
 34
34 -
 35
35 -
 36
36 -
 37
37 -
 38
38 -
 39
39 -
 40
40 -
 41
41 -
 42
42 -
 43
43 -
 44
44 -
 45
45 -
 46
46 -
 47
47 -
48
-
49
-
50
-
51
-
52
-
53
-
54
-
55
-
56
-
57
-
58
-
59
-
60
-
61
-
62
-
63
-
64
-
65
-
66
-
67
-
68
-
69
-
70
-
71
-
72
-
73
-
74
-
75
-
76
-
77
-
78
-
79
-
80
-
81
-
82
-
83
-
84
-
85
-
86
-
87
-
88
-
89
-
90
-
91
-
92
-
93
-
94
-
95
-
96
-
97
-
98
-
99
-
100
-
101
-
102
-
103
-
104
-
105
-
106
-
107
-
108
-
109
-
110
-
111
-
112
-
113
-
114
-
115
-
116
-
117
-
118
-
119
-
120
-
121
-
122
-
123
-
124
-
125
-
126
-
127
-
128
-
129
-
130
-
131
-
132
-
133
-
134
-
135
-
136
-
137
-
138
-
139
-
140
-
141
-
142
-
143
-
144
-
145
-
146
-
147
-
148
-
149
-
150
-
151
-
152
-
153
-
154
-
155
-
156
-
157
-
158
-
159
-
160
-
161
-
162
-
163
-
164
-
165
-
166
-
167
-
168
-
169
-
170
-
171
-
172
-
173
-
174
-
175
-
176
-
177
-
178
-
179
-
180
-
181
-
182
-
183
-
184
-
185
-
186
-
187
-
188
-
189
-
190
-
191
-
192
-
193
-
194
-
195
-
196
-
197
-
198
-
199
-
200
-
201
-
202
-
203
-
204
-
205
-
206
-
207
-
208
-
209
-
210
-
211
-
212
-
213
-
214
-
215
-
216
-
217
-
218
-
219
-
220
-
221
-
222
-
223
-
224
-
225
-
226
-
227
-
228
-
229
-
230
-
231
-
232
-
233
-
234
-
235
-
236
-
237
-
238
-
239
-
240
-
241
-
242
-
243
-
244
-
245
-
246
-
247
-
248
-
249
-
250
-
251
-
252
-
253
-
254
-
255
-
256
-
257
-
258
-
259
-
260
-
261
-
262
-
263
-
264
-
265
-
266
-
267
-
268
-
269
-
270
-
271
-
272
-
273
-
274
-
275
-
276
-
277
-
278
-
279
-
280
-
281
-
282
-
283
-
284
-
285
-
286
-
287
-
288
-
289
-
290
-
291
-
292
-
293
-
294
-
295
-
296
-
297
-
298
-
299
-
300
-
301
-
302
-
303
-
304
-
305
-
306
-
307
-
308
-
309
-
310
-
311
-
312
-
313
-
314
-
315
-
316
-
317
-
318
-
319
-
320
-
321
-
322
-
323
-
324
-
325
-
326
-
327
-
328
-
329
-
330
-
331
-
332
-
333
-
334
-
335
-
336
-
337
-
338
-
339
-
340
-
341
-
342
-
343
-
344
-
345
-
346
-
347
-
348
-
349
-
350
-
351
-
352
-
353
-
354
-
355
-
356
-
357
-
358
-
359
-
360
-
361
-
362
-
363
-
364
-
365
-
366
-
367
-
368
-
369
-
370
 |
 |

TableofContents
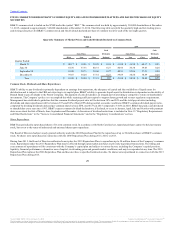
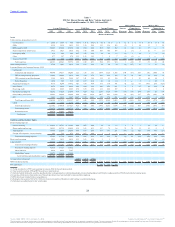
2015 compared to 2014
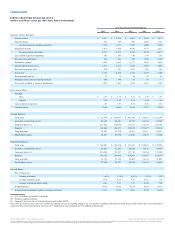
For 2015, net interest income on a FTE basis totaled $5.7 billion, an increase of $221 million or 4.0% compared to the prior year. The increase reflects higher
interest income due to acquisitions and organic loan growth, partially offset by lower yields on new loans and securities and runoff in the loan portfolio
acquired from the FDIC. Interest expense declined, reflecting lower rates and improvement in the mix of funding sources. The average cost of interest-bearing
deposits declined two basis points to 0.24%, reflecting reductions in time deposits and growth in interest checking and money market and savings. The
average cost of long-term debt declined from 2.36% to 2.13%, primarily due to the early extinguishment of $2.0 billion of higher-cost FHLB advances during
the last two years.
The FTE-adjusted NIM is the primary measure used in evaluating the gross profit margin from the portfolios of earning assets. The FTE-adjusted NIM was
3.32% in 2015 compared with 3.42% in 2014. The decline in the NIM reflects lower yields on loans and securities, partially offset by the lower funding costs
described above. The average annualized FTE yield for total loans and leases was 4.26% for 2015, compared to 4.42% for the prior year. The decrease was
primarily due to lower yields on new loan originations and the runoff of higher yielding loans acquired from the FDIC, partially offset by acquisition impact.
The FTE yield on the total securities portfolio was 2.36% for the year ended December 31, 2015, compared to 2.45% for the prior year.
The average rate paid on interest-bearing deposits for 2015 dropped to 0.24%, from 0.26% in 2014. This improvement was driven by changes in mix, with
time deposits representing a lower percentage of interest-bearing deposits at December 31, 2015.
The rate paid on average short-term borrowings was 0.15% in 2015, compared to 0.13% in 2014. The average rate on long-term debt during 2015 was 2.13%,
compared to 2.36% for the prior year. This decline reflects the previously mentioned early extinguishment of higher-cost FHLB advances. At December 31,
2015, the targeted Federal funds rate was a range of 0.25% to 0.50%, following the first rate increase in several years.
2014 compared to 2013
For 2014, net interest income on a FTE basis totaled $5.5 billion, a decrease of $245 million or 4.3% compared to the prior year. The decrease in net interest
income reflects lower yields on new loans and securities and runoff in the loan portfolio acquired from the FDIC, partially offset by lower funding costs,
which declined $123 million compared to 2013. The improvement in funding costs reflects a six basis point reduction in the average cost of interest-bearing
deposits due to improved mix and a 67 basis point reduction in the average cost of long-term debt primarily due to the early extinguishment of $1.1 billion
of higher-cost FHLB advances during the third quarter and lower rates on new issuances.
The FTE-adjusted NIM was 3.42% in 2014 compared with 3.68% in 2013. The decline in the NIM reflects lower yields on loans and securities, partially
offset by the lower funding costs described above. The average annualized FTE yield for total loans and leases was 4.42% for 2014, compared to 4.85% for
the prior year. The decrease was primarily due to lower yields on new loan originations and the runoff of higher yielding loans acquired from the FDIC. The
FTE yield on the total securities portfolio was 2.45% for the year ended December 31, 2014, compared to 2.51% for the prior year.
The average rate paid on interest-bearing deposits for 2014 dropped to 0.26%, from 0.32% in 2013. This improvement was driven by an 18 basis point
reduction in the cost of time deposits.
The rates paid on average short-term borrowings declined to 0.13% in 2014 from 0.16% in 2013. At December 31, 2014, the targeted Federal funds rate was a
range of zero percent to 0.25%. The average rate on long-term debt during 2014 was 2.36%, compared to 3.03% for the prior year. This decline reflects the
previously mentioned early extinguishment of $1.1 billion of higher-cost FHLB advances and lower rates on new issuances.
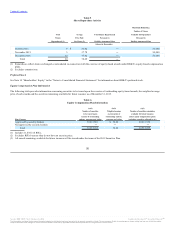
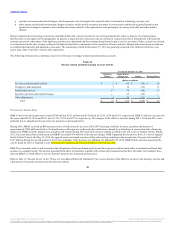
The following table sets forth the major components of net interest income and the related yields and rates, as well as the variances between the periods
caused by changes in interest rates versus changes in volumes. Changes attributable to the mix of assets and liabilities have been allocated proportionally
between the changes due to rate and the changes due to volume.
32
Source: BB&T CORP, 10-K, February 25, 2016 Powered by Morningstar® Document Research℠
The information contained herein may not be copied, adapted or distributed and is not warranted to be accurate, complete or timely. The user assumes all risks for any damages or losses arising from any use of this information,
except to the extent such damages or losses cannot be limited or excluded by applicable law. Past financial performance is no guarantee of future results.