BB&T 2015 Annual Report Download - page 41
Download and view the complete annual report
Please find page 41 of the 2015 BB&T annual report below. You can navigate through the pages in the report by either clicking on the pages listed below, or by using the keyword search tool below to find specific information within the annual report.-
 1
1 -
2
-
3
-
4
-
5
-
6
-
7
-
8
-
9
-
10
-
11
-
12
-
13
-
14
-
15
-
16
-
17
-
18
-
19
-
20
-
21
-
22
-
23
-
24
-
25
-
26
-
27
-
28
-
29
-
30
-
 31
31 -
 32
32 -
 33
33 -
 34
34 -
 35
35 -
 36
36 -
 37
37 -
 38
38 -
 39
39 -
 40
40 -
 41
41 -
 42
42 -
 43
43 -
 44
44 -
 45
45 -
 46
46 -
 47
47 -
 48
48 -
 49
49 -
 50
50 -
 51
51 -
52
-
53
-
54
-
55
-
56
-
57
-
58
-
59
-
60
-
61
-
62
-
63
-
64
-
65
-
66
-
67
-
68
-
69
-
70
-
71
-
72
-
73
-
74
-
75
-
76
-
77
-
78
-
79
-
80
-
81
-
82
-
83
-
84
-
85
-
86
-
87
-
88
-
89
-
90
-
91
-
92
-
93
-
94
-
95
-
96
-
97
-
98
-
99
-
100
-
101
-
102
-
103
-
104
-
105
-
106
-
107
-
108
-
109
-
110
-
111
-
112
-
113
-
114
-
115
-
116
-
117
-
118
-
119
-
120
-
121
-
122
-
123
-
124
-
125
-
126
-
127
-
128
-
129
-
130
-
131
-
132
-
133
-
134
-
135
-
136
-
137
-
138
-
139
-
140
-
141
-
142
-
143
-
144
-
145
-
146
-
147
-
148
-
149
-
150
-
151
-
152
-
153
-
154
-
155
-
156
-
157
-
158
-
159
-
160
-
161
-
162
-
163
-
164
-
165
-
166
-
167
-
168
-
169
-
170
-
171
-
172
-
173
-
174
-
175
-
176
-
177
-
178
-
179
-
180
-
181
-
182
-
183
-
184
-
185
-
186
-
187
-
188
-
189
-
190
-
191
-
192
-
193
-
194
-
195
-
196
-
197
-
198
-
199
-
200
-
201
-
202
-
203
-
204
-
205
-
206
-
207
-
208
-
209
-
210
-
211
-
212
-
213
-
214
-
215
-
216
-
217
-
218
-
219
-
220
-
221
-
222
-
223
-
224
-
225
-
226
-
227
-
228
-
229
-
230
-
231
-
232
-
233
-
234
-
235
-
236
-
237
-
238
-
239
-
240
-
241
-
242
-
243
-
244
-
245
-
246
-
247
-
248
-
249
-
250
-
251
-
252
-
253
-
254
-
255
-
256
-
257
-
258
-
259
-
260
-
261
-
262
-
263
-
264
-
265
-
266
-
267
-
268
-
269
-
270
-
271
-
272
-
273
-
274
-
275
-
276
-
277
-
278
-
279
-
280
-
281
-
282
-
283
-
284
-
285
-
286
-
287
-
288
-
289
-
290
-
291
-
292
-
293
-
294
-
295
-
296
-
297
-
298
-
299
-
300
-
301
-
302
-
303
-
304
-
305
-
306
-
307
-
308
-
309
-
310
-
311
-
312
-
313
-
314
-
315
-
316
-
317
-
318
-
319
-
320
-
321
-
322
-
323
-
324
-
325
-
326
-
327
-
328
-
329
-
330
-
331
-
332
-
333
-
334
-
335
-
336
-
337
-
338
-
339
-
340
-
341
-
342
-
343
-
344
-
345
-
346
-
347
-
348
-
349
-
350
-
351
-
352
-
353
-
354
-
355
-
356
-
357
-
358
-
359
-
360
-
361
-
362
-
363
-
364
-
365
-
366
-
367
-
368
-
369
-
370
 |
 |

TableofContents
Mortgage banking income totaled $395 million in 2014, a decrease of $170 million compared to the prior year. The decrease in mortgage banking income
includes a $182 million decrease in residential mortgage production revenues primarily due to decreases in the volume and margins on loan sales, which
have come under pressure due to increased competition and sustained low interest rates. The decline also reflects an $18 million reduction in fees primarily
due to a reduction in volume. These declines were partially offset by increased servicing income due to a larger servicing portfolio as well as an increase in
derivative income.
Net securities gains declined $54 million as the prior year contained a $46 million gain on the sale of GNMA securities. FDIC loss share income, net, was $50
million worse than 2013, primarily due to a $29 million change in the offset to the provision for covered loans, which was a benefit in 2014 due to improved
credit quality on the acquired loans.
Trust and investment advisory revenues increased $21 million to a record $221 million, primarily the result of higher investment advisory revenues during
the current year. Other income decreased $96 million in 2014, primarily due to a $31 million gain on the sale of a consumer lending subsidiary in 2013, a
$24 million decrease in income from assets related to certain post-employment benefits, which is offset in personnel expense, and an $8 million decrease in
letter of credit fees. These declines and other smaller declines were partially offset by a $19 million increase in leasing income.
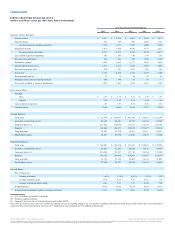
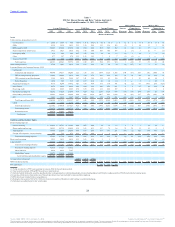
Noninterest Expense
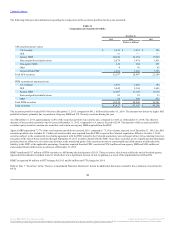
The following table provides a breakdown of BB&T’s noninterest expense:
Personnel expense $ 3,469 $ 3,180 $ 3,293 9.1 % (3.4)%
Occupancy and equipment expense 708 682 692 3.8 (1.4)
Software expense 192 174 158 10.3 10.1
Loan-related expense 150 267 188 (43.8) 42.0
Outside IT services 135 115 89 17.4 29.2
Professional services 130 139 189 (6.5) (26.5)
Amortization of intangibles 105 91 106 15.4 (14.2)
Regulatory charges 101 106 143 (4.7) (25.9)
Foreclosed property expense 53 40 55 32.5 (27.3)
Merger-related and restructuring charges, net 165 46 46 NM ―
Loss on early extinguishment of debt 172 122 ― 41.0 NM
Other expense 886 890 818 (0.4) 8.8
Total noninterest expense $ 6,266 $ 5,852 $ 5,777 7.1 1.3
2015 compared to 2014
Noninterest expense totaled $6.3 billion for 2015, an increase of $414 million from 2014. This increase was driven by higher personnel expense, merger-
related and restructuring charges and loss on early extinguishment of debt, partially offset by lower loan-related expense.
Personnel expense is the largest component of noninterest expense and includes salaries, wages and incentives, as well as pension and other employee benefit
costs. Personnel expense totaled $3.5 billion, a $289 million increase compared to 2014. This increase was driven by a $114 million increase in salaries,
which was primarily due to additional headcount from acquisitions. Personnel expense also increased due to a $74 million increase in pension expense that
reflects higher amortization, service and interest costs, partially offset by the estimated return on higher plan assets. Additionally, personnel expense reflects a
$50 million increase in employee medical and insurance benefits and a $32 million increase in incentives.
Merger-related and restructuring charges totaled $165 million, an increase of $119 million compared to 2014. This increase was primarily related to the
Susquehanna acquisition, with additional amounts related to The Bank of Kentucky and the planned acquisition of National Penn.
Loss on early extinguishment of debt was $172 million for 2015, compared to $122 million for 2014. The combined debt extinguishments for the two years
totaled $2.0 billion of FHLB advances with a weighted average interest rate of 4.5%.
36
Source: BB&T CORP, 10-K, February 25, 2016 Powered by Morningstar® Document Research℠
The information contained herein may not be copied, adapted or distributed and is not warranted to be accurate, complete or timely. The user assumes all risks for any damages or losses arising from any use of this information,
except to the extent such damages or losses cannot be limited or excluded by applicable law. Past financial performance is no guarantee of future results.