BB&T 2015 Annual Report Download - page 74
Download and view the complete annual report
Please find page 74 of the 2015 BB&T annual report below. You can navigate through the pages in the report by either clicking on the pages listed below, or by using the keyword search tool below to find specific information within the annual report.-
 1
1 -
2
-
3
-
4
-
5
-
6
-
7
-
8
-
9
-
10
-
11
-
12
-
13
-
14
-
15
-
16
-
17
-
18
-
19
-
20
-
21
-
22
-
23
-
24
-
25
-
26
-
27
-
28
-
29
-
30
-
31
-
32
-
33
-
34
-
35
-
36
-
37
-
38
-
39
-
40
-
41
-
42
-
43
-
44
-
45
-
46
-
47
-
48
-
49
-
50
-
51
-
52
-
53
-
54
-
55
-
56
-
57
-
58
-
59
-
60
-
61
-
62
-
63
-
 64
64 -
 65
65 -
 66
66 -
 67
67 -
 68
68 -
 69
69 -
 70
70 -
 71
71 -
 72
72 -
 73
73 -
 74
74 -
 75
75 -
 76
76 -
 77
77 -
 78
78 -
 79
79 -
 80
80 -
 81
81 -
 82
82 -
 83
83 -
 84
84 -
85
-
86
-
87
-
88
-
89
-
90
-
91
-
92
-
93
-
94
-
95
-
96
-
97
-
98
-
99
-
100
-
101
-
102
-
103
-
104
-
105
-
106
-
107
-
108
-
109
-
110
-
111
-
112
-
113
-
114
-
115
-
116
-
117
-
118
-
119
-
120
-
121
-
122
-
123
-
124
-
125
-
126
-
127
-
128
-
129
-
130
-
131
-
132
-
133
-
134
-
135
-
136
-
137
-
138
-
139
-
140
-
141
-
142
-
143
-
144
-
145
-
146
-
147
-
148
-
149
-
150
-
151
-
152
-
153
-
154
-
155
-
156
-
157
-
158
-
159
-
160
-
161
-
162
-
163
-
164
-
165
-
166
-
167
-
168
-
169
-
170
-
171
-
172
-
173
-
174
-
175
-
176
-
177
-
178
-
179
-
180
-
181
-
182
-
183
-
184
-
185
-
186
-
187
-
188
-
189
-
190
-
191
-
192
-
193
-
194
-
195
-
196
-
197
-
198
-
199
-
200
-
201
-
202
-
203
-
204
-
205
-
206
-
207
-
208
-
209
-
210
-
211
-
212
-
213
-
214
-
215
-
216
-
217
-
218
-
219
-
220
-
221
-
222
-
223
-
224
-
225
-
226
-
227
-
228
-
229
-
230
-
231
-
232
-
233
-
234
-
235
-
236
-
237
-
238
-
239
-
240
-
241
-
242
-
243
-
244
-
245
-
246
-
247
-
248
-
249
-
250
-
251
-
252
-
253
-
254
-
255
-
256
-
257
-
258
-
259
-
260
-
261
-
262
-
263
-
264
-
265
-
266
-
267
-
268
-
269
-
270
-
271
-
272
-
273
-
274
-
275
-
276
-
277
-
278
-
279
-
280
-
281
-
282
-
283
-
284
-
285
-
286
-
287
-
288
-
289
-
290
-
291
-
292
-
293
-
294
-
295
-
296
-
297
-
298
-
299
-
300
-
301
-
302
-
303
-
304
-
305
-
306
-
307
-
308
-
309
-
310
-
311
-
312
-
313
-
314
-
315
-
316
-
317
-
318
-
319
-
320
-
321
-
322
-
323
-
324
-
325
-
326
-
327
-
328
-
329
-
330
-
331
-
332
-
333
-
334
-
335
-
336
-
337
-
338
-
339
-
340
-
341
-
342
-
343
-
344
-
345
-
346
-
347
-
348
-
349
-
350
-
351
-
352
-
353
-
354
-
355
-
356
-
357
-
358
-
359
-
360
-
361
-
362
-
363
-
364
-
365
-
366
-
367
-
368
-
369
-
370
 |
 |

TableofContents
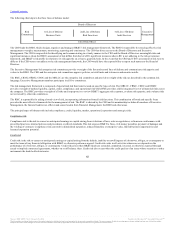
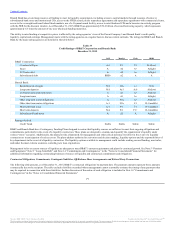
The asset/liability management process is designed to achieve relatively stable NIM and assure liquidity by coordinating the volumes, maturities or repricing
opportunities of earning assets, deposits and borrowed funds. Among other things, this process gives consideration to prepayment trends related to securities,
loans and leases and certain deposits that have no stated maturity. Prepayment assumptions are developed using a combination of market data and internal
historical prepayment experience for residential mortgage-related loans and securities, and internal historical prepayment experience for client deposits with
no stated maturity and loans that are not residential mortgage related. These assumptions are subject to monthly back-testing, and are adjusted as deemed
necessary to reflect changes in interest rates relative to the reference rate of the underlying assets or liabilities. On a monthly basis, BB&T evaluates the
accuracy of its Simulation model, which includes an evaluation of its prepayment assumptions, to ensure that all significant assumptions inherent in the
model appropriately reflect changes in the interest rate environment and related trends in prepayment activity. It is the responsibility of the MRLCC to
determine and achieve the most appropriate volume and mix of earning assets and interest-bearing liabilities, as well as to ensure an adequate level of
liquidity and capital, within the context of corporate performance goals. The MRLCC also sets policy guidelines and establishes long-term strategies with
respect to interest rate risk exposure and liquidity. The MRLCC meets regularly to review BB&T’s interest rate risk and liquidity positions in relation to
present and prospective market and business conditions, and adopts funding and balance sheet management strategies that are intended to ensure that the
potential impacts on earnings and liquidity as a result of fluctuations in interest rates are within acceptable tolerance guidelines.
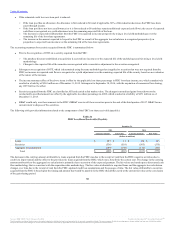
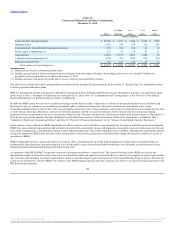
BB&T uses derivatives primarily to manage economic risk related to securities, commercial loans, MSRs and mortgage banking operations, long-term debt
and other funding sources. BB&T also uses derivatives to facilitate transactions on behalf of its clients. As of December 31, 2015, BB&T had derivative
financial instruments outstanding with notional amounts totaling $67.5 billion, with a net fair value of a gain of $178 million. See Note 18 “Derivative
Financial Instruments” in the “Notes to Consolidated Financial Statements” herein for additional disclosures.
The majority of BB&T’s assets and liabilities are monetary in nature and, therefore, differ greatly from most commercial and industrial companies that have
significant investments in fixed assets or inventories. Fluctuations in interest rates and actions of the FRB to regulate the availability and cost of credit have a
greater effect on a financial institution’s profitability than do the effects of higher costs for goods and services. Through its balance sheet management
function, which is monitored by the MRLCC, management believes that BB&T is positioned to respond to changing needs for liquidity, changes in interest
rates and inflationary trends.
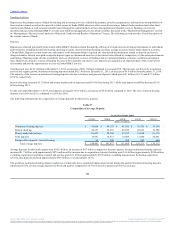
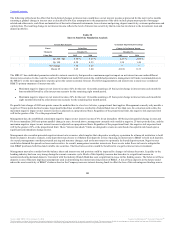
Management uses the Simulation to measure the sensitivity of projected earnings to changes in interest rates. The Simulation projects net interest income and
interest rate risk for a rolling two-year period of time. The Simulation takes into account the current contractual agreements that BB&T has made with its
customers on deposits, borrowings, loans, investments and commitments to enter into those transactions. Furthermore, the Simulation considers the impact of
expected customer behavior. Management monitors BB&T’s interest sensitivity by means of a model that incorporates the current volumes, average rates
earned and paid, and scheduled maturities and payments of asset and liability portfolios, together with multiple scenarios that include projected
prepayments, repricing opportunities and anticipated volume growth. Using this information, the model projects earnings based on projected portfolio
balances under multiple interest rate scenarios. This level of detail is needed to simulate the effect that changes in interest rates and portfolio balances may
have on the earnings of BB&T. This method is subject to the accuracy of the assumptions that underlie the process, but management believes that it provides
a better illustration of the sensitivity of earnings to changes in interest rates than other analyses such as static or dynamic gap. In addition to the Simulation,
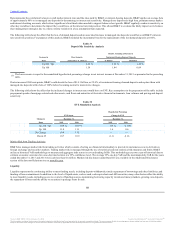
BB&T uses EVE analysis to focus on projected changes in capital given potential changes in interest rates. This measure also allows BB&T to analyze
interest rate risk that falls outside the analysis window contained in the Simulation. The EVE model is a discounted cash flow of the portfolio of assets,
liabilities, and derivative instruments. The difference in the present value of assets minus the present value of liabilities is defined as the economic value of
equity.
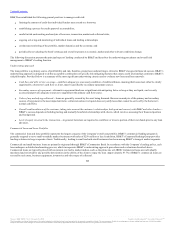
The asset/liability management process requires a number of key assumptions. Management determines the most likely outlook for the economy and interest
rates by analyzing external factors, including published economic projections and data, the effects of likely monetary and fiscal policies, as well as any
enacted or prospective regulatory changes. BB&T’s current and prospective liquidity position, current balance sheet volumes and projected growth,
accessibility of funds for short-term needs and capital maintenance are also considered. This data is combined with various interest rate scenarios to provide
management with the information necessary to analyze interest sensitivity and to aid in the development of strategies to reach performance goals.
67
Source: BB&T CORP, 10-K, February 25, 2016 Powered by Morningstar® Document Research℠
The information contained herein may not be copied, adapted or distributed and is not warranted to be accurate, complete or timely. The user assumes all risks for any damages or losses arising from any use of this information,
except to the extent such damages or losses cannot be limited or excluded by applicable law. Past financial performance is no guarantee of future results.