BB&T 2015 Annual Report Download - page 145
Download and view the complete annual report
Please find page 145 of the 2015 BB&T annual report below. You can navigate through the pages in the report by either clicking on the pages listed below, or by using the keyword search tool below to find specific information within the annual report.-
 1
1 -
2
-
3
-
4
-
5
-
6
-
7
-
8
-
9
-
10
-
11
-
12
-
13
-
14
-
15
-
16
-
17
-
18
-
19
-
20
-
21
-
22
-
23
-
24
-
25
-
26
-
27
-
28
-
29
-
30
-
31
-
32
-
33
-
34
-
35
-
36
-
37
-
38
-
39
-
40
-
41
-
42
-
43
-
44
-
45
-
46
-
47
-
48
-
49
-
50
-
51
-
52
-
53
-
54
-
55
-
56
-
57
-
58
-
59
-
60
-
61
-
62
-
63
-
64
-
65
-
66
-
67
-
68
-
69
-
70
-
71
-
72
-
73
-
74
-
75
-
76
-
77
-
78
-
79
-
80
-
81
-
82
-
83
-
84
-
85
-
86
-
87
-
88
-
89
-
90
-
91
-
92
-
93
-
94
-
95
-
96
-
97
-
98
-
99
-
100
-
101
-
102
-
103
-
104
-
105
-
106
-
107
-
108
-
109
-
110
-
111
-
112
-
113
-
114
-
115
-
116
-
117
-
118
-
119
-
120
-
121
-
122
-
123
-
124
-
125
-
126
-
127
-
128
-
129
-
130
-
131
-
132
-
133
-
134
-
 135
135 -
 136
136 -
 137
137 -
 138
138 -
 139
139 -
 140
140 -
 141
141 -
 142
142 -
 143
143 -
 144
144 -
 145
145 -
 146
146 -
 147
147 -
 148
148 -
 149
149 -
 150
150 -
 151
151 -
 152
152 -
 153
153 -
 154
154 -
 155
155 -
156
-
157
-
158
-
159
-
160
-
161
-
162
-
163
-
164
-
165
-
166
-
167
-
168
-
169
-
170
-
171
-
172
-
173
-
174
-
175
-
176
-
177
-
178
-
179
-
180
-
181
-
182
-
183
-
184
-
185
-
186
-
187
-
188
-
189
-
190
-
191
-
192
-
193
-
194
-
195
-
196
-
197
-
198
-
199
-
200
-
201
-
202
-
203
-
204
-
205
-
206
-
207
-
208
-
209
-
210
-
211
-
212
-
213
-
214
-
215
-
216
-
217
-
218
-
219
-
220
-
221
-
222
-
223
-
224
-
225
-
226
-
227
-
228
-
229
-
230
-
231
-
232
-
233
-
234
-
235
-
236
-
237
-
238
-
239
-
240
-
241
-
242
-
243
-
244
-
245
-
246
-
247
-
248
-
249
-
250
-
251
-
252
-
253
-
254
-
255
-
256
-
257
-
258
-
259
-
260
-
261
-
262
-
263
-
264
-
265
-
266
-
267
-
268
-
269
-
270
-
271
-
272
-
273
-
274
-
275
-
276
-
277
-
278
-
279
-
280
-
281
-
282
-
283
-
284
-
285
-
286
-
287
-
288
-
289
-
290
-
291
-
292
-
293
-
294
-
295
-
296
-
297
-
298
-
299
-
300
-
301
-
302
-
303
-
304
-
305
-
306
-
307
-
308
-
309
-
310
-
311
-
312
-
313
-
314
-
315
-
316
-
317
-
318
-
319
-
320
-
321
-
322
-
323
-
324
-
325
-
326
-
327
-
328
-
329
-
330
-
331
-
332
-
333
-
334
-
335
-
336
-
337
-
338
-
339
-
340
-
341
-
342
-
343
-
344
-
345
-
346
-
347
-
348
-
349
-
350
-
351
-
352
-
353
-
354
-
355
-
356
-
357
-
358
-
359
-
360
-
361
-
362
-
363
-
364
-
365
-
366
-
367
-
368
-
369
-
370
 |
 |

TableofContents
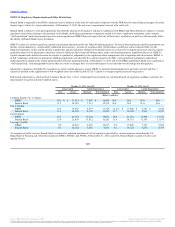
The transfer of funds in the form of dividends, loans or advances from bank subsidiaries to the Parent Company is restricted. Federal law requires loans to the
Parent Company or its affiliates to be secured and at market terms and generally limits loans to the Parent Company or an individual affiliate to 10% of
Branch Bank’s unimpaired capital and surplus. In the aggregate, loans to the Parent Company and all affiliates cannot exceed 20% of the bank’s unimpaired
capital and surplus.
Dividend payments to the Parent Company by Branch Bank are subject to regulatory review and statutory limitations and, in some instances, regulatory
approval. In general, dividends from Branch Bank to the Parent Company are limited by rules which compare dividends to net income for regulatory-defined
periods. Furthermore, dividends are restricted by regulatory minimum capital constraints.
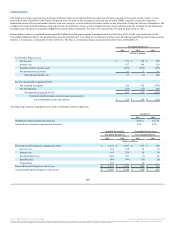
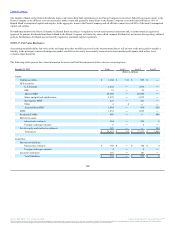
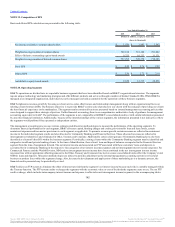
Accounting standards define fair value as the exchange price that would be received on the measurement date to sell an asset or the price paid to transfer a
liability in the principal or most advantageous market available to the entity in an orderly transaction between market participants, with a three level
valuation input hierarchy.
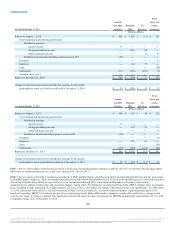
The following tables present fair value information for assets and liabilities measured at fair value on a recurring basis.
Assets:
Trading securities $ 1,180 $ 311 $ 869 $ ―
AFS securities:
U.S. Treasury 1,832 ― 1,832 ―
GSE 51 ― 51 ―
Agency MBS 20,046 ― 20,046 ―
States and political subdivisions 2,079 ― 2,079 ―
Non-agency MBS 221 ― 221 ―
Other 4 4 ― ―
Acquired from FDIC 1,064 ― 438 626
LHFS 1,035 ― 1,035 ―
Residential MSRs 880 ― ― 880
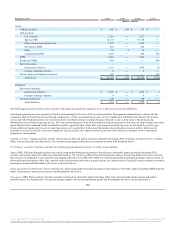
Derivative assets:
Interest rate contracts 964 ― 956 8
Foreign exchange contracts 6 ― 6 ―
Private equity and similar investments 289 ― ― 289
Total assets $ 29,651 $ 315 $ 27,533 $ 1,803
Liabilities:
Derivative liabilities:
Interest rate contracts $ 788 $ ― $ 784 $ 4
Foreign exchange contracts 4 ― 4 ―
Securities sold short 147 ― 147 ―
Total liabilities $ 939 $ ― $ 935 $ 4
132
Source: BB&T CORP, 10-K, February 25, 2016 Powered by Morningstar® Document Research℠
The information contained herein may not be copied, adapted or distributed and is not warranted to be accurate, complete or timely. The user assumes all risks for any damages or losses arising from any use of this information,
except to the extent such damages or losses cannot be limited or excluded by applicable law. Past financial performance is no guarantee of future results.