BB&T 2015 Annual Report Download - page 42
Download and view the complete annual report
Please find page 42 of the 2015 BB&T annual report below. You can navigate through the pages in the report by either clicking on the pages listed below, or by using the keyword search tool below to find specific information within the annual report.-
 1
1 -
2
-
3
-
4
-
5
-
6
-
7
-
8
-
9
-
10
-
11
-
12
-
13
-
14
-
15
-
16
-
17
-
18
-
19
-
20
-
21
-
22
-
23
-
24
-
25
-
26
-
27
-
28
-
29
-
30
-
31
-
 32
32 -
 33
33 -
 34
34 -
 35
35 -
 36
36 -
 37
37 -
 38
38 -
 39
39 -
 40
40 -
 41
41 -
 42
42 -
 43
43 -
 44
44 -
 45
45 -
 46
46 -
 47
47 -
 48
48 -
 49
49 -
 50
50 -
 51
51 -
 52
52 -
53
-
54
-
55
-
56
-
57
-
58
-
59
-
60
-
61
-
62
-
63
-
64
-
65
-
66
-
67
-
68
-
69
-
70
-
71
-
72
-
73
-
74
-
75
-
76
-
77
-
78
-
79
-
80
-
81
-
82
-
83
-
84
-
85
-
86
-
87
-
88
-
89
-
90
-
91
-
92
-
93
-
94
-
95
-
96
-
97
-
98
-
99
-
100
-
101
-
102
-
103
-
104
-
105
-
106
-
107
-
108
-
109
-
110
-
111
-
112
-
113
-
114
-
115
-
116
-
117
-
118
-
119
-
120
-
121
-
122
-
123
-
124
-
125
-
126
-
127
-
128
-
129
-
130
-
131
-
132
-
133
-
134
-
135
-
136
-
137
-
138
-
139
-
140
-
141
-
142
-
143
-
144
-
145
-
146
-
147
-
148
-
149
-
150
-
151
-
152
-
153
-
154
-
155
-
156
-
157
-
158
-
159
-
160
-
161
-
162
-
163
-
164
-
165
-
166
-
167
-
168
-
169
-
170
-
171
-
172
-
173
-
174
-
175
-
176
-
177
-
178
-
179
-
180
-
181
-
182
-
183
-
184
-
185
-
186
-
187
-
188
-
189
-
190
-
191
-
192
-
193
-
194
-
195
-
196
-
197
-
198
-
199
-
200
-
201
-
202
-
203
-
204
-
205
-
206
-
207
-
208
-
209
-
210
-
211
-
212
-
213
-
214
-
215
-
216
-
217
-
218
-
219
-
220
-
221
-
222
-
223
-
224
-
225
-
226
-
227
-
228
-
229
-
230
-
231
-
232
-
233
-
234
-
235
-
236
-
237
-
238
-
239
-
240
-
241
-
242
-
243
-
244
-
245
-
246
-
247
-
248
-
249
-
250
-
251
-
252
-
253
-
254
-
255
-
256
-
257
-
258
-
259
-
260
-
261
-
262
-
263
-
264
-
265
-
266
-
267
-
268
-
269
-
270
-
271
-
272
-
273
-
274
-
275
-
276
-
277
-
278
-
279
-
280
-
281
-
282
-
283
-
284
-
285
-
286
-
287
-
288
-
289
-
290
-
291
-
292
-
293
-
294
-
295
-
296
-
297
-
298
-
299
-
300
-
301
-
302
-
303
-
304
-
305
-
306
-
307
-
308
-
309
-
310
-
311
-
312
-
313
-
314
-
315
-
316
-
317
-
318
-
319
-
320
-
321
-
322
-
323
-
324
-
325
-
326
-
327
-
328
-
329
-
330
-
331
-
332
-
333
-
334
-
335
-
336
-
337
-
338
-
339
-
340
-
341
-
342
-
343
-
344
-
345
-
346
-
347
-
348
-
349
-
350
-
351
-
352
-
353
-
354
-
355
-
356
-
357
-
358
-
359
-
360
-
361
-
362
-
363
-
364
-
365
-
366
-
367
-
368
-
369
-
370
 |
 |

TableofContents
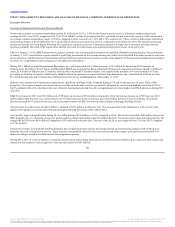
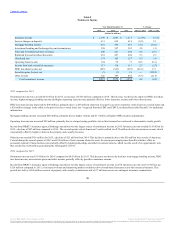
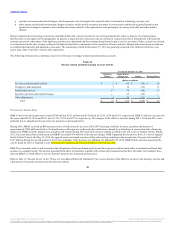
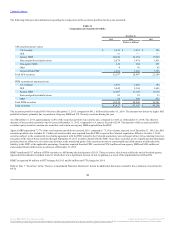
Occupancy and equipment expense totaled $708 million for 2015, compared to $682 million for 2014. The increase reflects the acquisition activity
occurring during the year.
Loan-related expense totaled $150 million for 2015, a decrease of $117 million compared to the prior year. This decrease is largely the result of lower claims
and chargeoffs in the current year, as well as charges recorded in the prior year of $33 million related to the FHA-insured loan origination process and $27
million related to a review of mortgage lending processes.
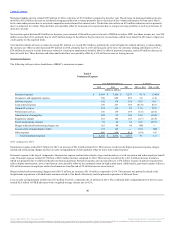
2014 compared to 2013
Personnel expense totaled $3.2 billion, a decrease of $113 million compared to 2013. This decline was driven by a $110 million reduction in qualified
pension plan expense, primarily due to a higher expected return on plan assets and a change in the actuarial discount rate used to determine the projected
benefit obligation as of the beginning of the year that resulted in reduced amortization expense during 2014.
Professional services expense totaled $139 million, a decrease of $50 million compared to the prior year. This decrease was driven by a reduction in legal fees
as well as services associated with regulatory initiatives. Regulatory charges totaled $106 million for 2014, a decline of $37 million compared to 2013,
which primarily reflects a reduction in FDIC insurance due to long-term debt issuances and improved credit conditions.
Loan-related expense totaled $267 million for 2014, an increase of $79 million compared to the prior year. This increase includes a $33 million mortgage
loan indemnification reserve adjustment, which represents an increase in estimated losses that may be incurred on FHA-insured mortgage loans that have not
yet defaulted, and a mortgage reserve adjustment of $27 million related to a review of mortgage lending processes.
Outside IT services totaled $115 million during 2014, compared to $89 million for 2013. This increase was due to third-party costs associated with the new
ERP and commercial loan systems.
A loss on early extinguishment of debt of $122 million was recorded during 2014 in connection with the early termination of $1.1 billion of higher cost
FHLB advances. The transaction occurred during the third quarter of 2014 and had a beneficial impact to net interest income for the remainder of the year.
Other expense was $890 million for 2014, an increase of $72 million compared to 2013. During June 2014, BB&T received notice from the HUD-OIG that
BB&T had been selected for an audit/survey to assess BB&T's compliance with FHA loan origination and quality control requirements. In late 2014 and in
2015, BB&T received subpoenas from the HUD-OIG and the Department of Justice seeking additional information regarding its lending practices in
connection with loans insured by the FHA. BB&T is cooperating with the investigation. While the outcome of the investigation is unknown and neither the
Department of Justice nor the HUD-OIG has asserted any claims, similar reviews and related matters with other financial institutions have resulted in cash
settlements and other remedial actions. BB&T identified a potential exposure related to losses incurred by the FHA on defaulted loans that ranges from $25
million to $105 million and recognized an $85 million charge during 2014. The income statement impact of this adjustment was included in other expense
on the Consolidated Statements of lncome. The ultimate resolution of this matter is uncertain and the estimates of this exposure are subject to the application
of significant judgment and therefore cannot be predicted with certainty at this time.
The increase in other expense also includes a $17 million increase in depreciation related to operating leases. These increases were partially offset by a $15
million favorable franchise tax adjustment and a decline in expense due to the prior year $11 million write-down of owned real estate.
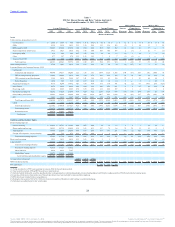
Merger-Related and Restructuring Charges
BB&T has incurred certain merger-related and restructuring charges, which are reflected in BB&T’s Consolidated Statements of Income as a category of
noninterest expense. Merger-related and restructuring expenses or credits include:
·severance and personnel-related costs or credits, which typically occur in corporate support and data processing functions;
·occupancy and equipment charges or credits, which relate to costs or gains associated with lease terminations, obsolete equipment write-offs and the
sale of duplicate facilities and equipment;
·professional services, which relate to investment banking advisory fees and other consulting services pertaining to the transaction;
37
Source: BB&T CORP, 10-K, February 25, 2016 Powered by Morningstar® Document Research℠
The information contained herein may not be copied, adapted or distributed and is not warranted to be accurate, complete or timely. The user assumes all risks for any damages or losses arising from any use of this information,
except to the extent such damages or losses cannot be limited or excluded by applicable law. Past financial performance is no guarantee of future results.