BB&T 2015 Annual Report Download - page 134
Download and view the complete annual report
Please find page 134 of the 2015 BB&T annual report below. You can navigate through the pages in the report by either clicking on the pages listed below, or by using the keyword search tool below to find specific information within the annual report.-
 1
1 -
2
-
3
-
4
-
5
-
6
-
7
-
8
-
9
-
10
-
11
-
12
-
13
-
14
-
15
-
16
-
17
-
18
-
19
-
20
-
21
-
22
-
23
-
24
-
25
-
26
-
27
-
28
-
29
-
30
-
31
-
32
-
33
-
34
-
35
-
36
-
37
-
38
-
39
-
40
-
41
-
42
-
43
-
44
-
45
-
46
-
47
-
48
-
49
-
50
-
51
-
52
-
53
-
54
-
55
-
56
-
57
-
58
-
59
-
60
-
61
-
62
-
63
-
64
-
65
-
66
-
67
-
68
-
69
-
70
-
71
-
72
-
73
-
74
-
75
-
76
-
77
-
78
-
79
-
80
-
81
-
82
-
83
-
84
-
85
-
86
-
87
-
88
-
89
-
90
-
91
-
92
-
93
-
94
-
95
-
96
-
97
-
98
-
99
-
100
-
101
-
102
-
103
-
104
-
105
-
106
-
107
-
108
-
109
-
110
-
111
-
112
-
113
-
114
-
115
-
116
-
117
-
118
-
119
-
120
-
121
-
122
-
123
-
 124
124 -
 125
125 -
 126
126 -
 127
127 -
 128
128 -
 129
129 -
 130
130 -
 131
131 -
 132
132 -
 133
133 -
 134
134 -
 135
135 -
 136
136 -
 137
137 -
 138
138 -
 139
139 -
 140
140 -
 141
141 -
 142
142 -
 143
143 -
 144
144 -
145
-
146
-
147
-
148
-
149
-
150
-
151
-
152
-
153
-
154
-
155
-
156
-
157
-
158
-
159
-
160
-
161
-
162
-
163
-
164
-
165
-
166
-
167
-
168
-
169
-
170
-
171
-
172
-
173
-
174
-
175
-
176
-
177
-
178
-
179
-
180
-
181
-
182
-
183
-
184
-
185
-
186
-
187
-
188
-
189
-
190
-
191
-
192
-
193
-
194
-
195
-
196
-
197
-
198
-
199
-
200
-
201
-
202
-
203
-
204
-
205
-
206
-
207
-
208
-
209
-
210
-
211
-
212
-
213
-
214
-
215
-
216
-
217
-
218
-
219
-
220
-
221
-
222
-
223
-
224
-
225
-
226
-
227
-
228
-
229
-
230
-
231
-
232
-
233
-
234
-
235
-
236
-
237
-
238
-
239
-
240
-
241
-
242
-
243
-
244
-
245
-
246
-
247
-
248
-
249
-
250
-
251
-
252
-
253
-
254
-
255
-
256
-
257
-
258
-
259
-
260
-
261
-
262
-
263
-
264
-
265
-
266
-
267
-
268
-
269
-
270
-
271
-
272
-
273
-
274
-
275
-
276
-
277
-
278
-
279
-
280
-
281
-
282
-
283
-
284
-
285
-
286
-
287
-
288
-
289
-
290
-
291
-
292
-
293
-
294
-
295
-
296
-
297
-
298
-
299
-
300
-
301
-
302
-
303
-
304
-
305
-
306
-
307
-
308
-
309
-
310
-
311
-
312
-
313
-
314
-
315
-
316
-
317
-
318
-
319
-
320
-
321
-
322
-
323
-
324
-
325
-
326
-
327
-
328
-
329
-
330
-
331
-
332
-
333
-
334
-
335
-
336
-
337
-
338
-
339
-
340
-
341
-
342
-
343
-
344
-
345
-
346
-
347
-
348
-
349
-
350
-
351
-
352
-
353
-
354
-
355
-
356
-
357
-
358
-
359
-
360
-
361
-
362
-
363
-
364
-
365
-
366
-
367
-
368
-
369
-
370
 |
 |

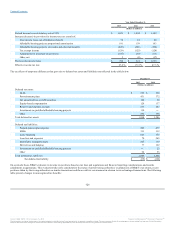
TableofContents
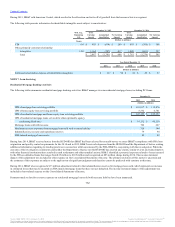
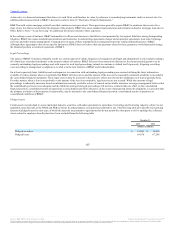
Federal income taxes at statutory rate of 35% $ 1,021 $ 1,094 $ 1,149
Increase (decrease) in provision for income taxes as a result of:
State income taxes, net of federal tax benefit 72 61 86
Affordable housing projects proportional amortization 181 159 143
Affordable housing projects tax credits and other tax benefits (249) (221) (196)
Tax exempt income (129) (125) (128)
Adjustments for uncertain tax positions (107) (39) 516
Other, net 5 (8) (17)
Provision for income taxes $ 794 $ 921 $ 1,553
Effective income tax rate 27.2 % 29.5 % 47.3 %
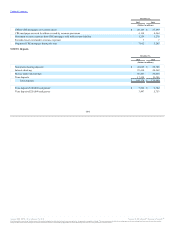
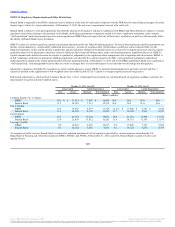
The tax effects of temporary differences that gave rise to deferred tax assets and liabilities are reflected in the table below:
Deferred tax assets:
ALLL $ 553 $ 556
Postretirement plans 431 372
Net unrealized loss on AFS securities 124 36
Equity-based compensation 129 137
Reserves and expense accruals 255 247
Investments in qualified affordable housing projects 110 ―
Other 292 198
Total deferred tax assets 1,894 1,546
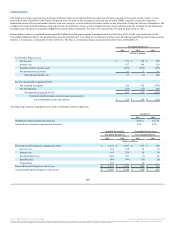
Deferred tax liabilities:
Prepaid pension plan expense 509 477
MSRs 331 312
Lease financing 663 375
Loan fees and expenses 70 265
Identifiable intangible assets 207 139
Derivatives and hedging 77 122
Investments in qualified affordable housing projects ― 25
Other 92 93
Total deferred tax liabilities 1,949 1,808
Net deferred tax liability $ (55) $ (262)
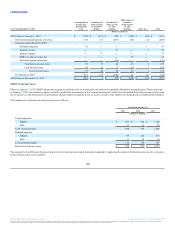
On a periodic basis, BB&T evaluates its income tax positions based on tax laws and regulations and financial reporting considerations, and records
adjustments as appropriate. This evaluation takes into consideration the status of current taxing authorities’ examinations of BB&T’s tax returns, recent
positions taken by the taxing authorities on similar transactions and the overall tax environment in relation to tax-advantaged transactions. The following
table presents changes in unrecognized tax benefits:
121
Source: BB&T CORP, 10-K, February 25, 2016 Powered by Morningstar® Document Research℠
The information contained herein may not be copied, adapted or distributed and is not warranted to be accurate, complete or timely. The user assumes all risks for any damages or losses arising from any use of this information,
except to the extent such damages or losses cannot be limited or excluded by applicable law. Past financial performance is no guarantee of future results.