BB&T 2015 Annual Report Download - page 83
Download and view the complete annual report
Please find page 83 of the 2015 BB&T annual report below. You can navigate through the pages in the report by either clicking on the pages listed below, or by using the keyword search tool below to find specific information within the annual report.-
 1
1 -
2
-
3
-
4
-
5
-
6
-
7
-
8
-
9
-
10
-
11
-
12
-
13
-
14
-
15
-
16
-
17
-
18
-
19
-
20
-
21
-
22
-
23
-
24
-
25
-
26
-
27
-
28
-
29
-
30
-
31
-
32
-
33
-
34
-
35
-
36
-
37
-
38
-
39
-
40
-
41
-
42
-
43
-
44
-
45
-
46
-
47
-
48
-
49
-
50
-
51
-
52
-
53
-
54
-
55
-
56
-
57
-
58
-
59
-
60
-
61
-
62
-
63
-
64
-
65
-
66
-
67
-
68
-
69
-
70
-
71
-
72
-
 73
73 -
 74
74 -
 75
75 -
 76
76 -
 77
77 -
 78
78 -
 79
79 -
 80
80 -
 81
81 -
 82
82 -
 83
83 -
 84
84 -
 85
85 -
 86
86 -
 87
87 -
 88
88 -
 89
89 -
 90
90 -
 91
91 -
 92
92 -
 93
93 -
94
-
95
-
96
-
97
-
98
-
99
-
100
-
101
-
102
-
103
-
104
-
105
-
106
-
107
-
108
-
109
-
110
-
111
-
112
-
113
-
114
-
115
-
116
-
117
-
118
-
119
-
120
-
121
-
122
-
123
-
124
-
125
-
126
-
127
-
128
-
129
-
130
-
131
-
132
-
133
-
134
-
135
-
136
-
137
-
138
-
139
-
140
-
141
-
142
-
143
-
144
-
145
-
146
-
147
-
148
-
149
-
150
-
151
-
152
-
153
-
154
-
155
-
156
-
157
-
158
-
159
-
160
-
161
-
162
-
163
-
164
-
165
-
166
-
167
-
168
-
169
-
170
-
171
-
172
-
173
-
174
-
175
-
176
-
177
-
178
-
179
-
180
-
181
-
182
-
183
-
184
-
185
-
186
-
187
-
188
-
189
-
190
-
191
-
192
-
193
-
194
-
195
-
196
-
197
-
198
-
199
-
200
-
201
-
202
-
203
-
204
-
205
-
206
-
207
-
208
-
209
-
210
-
211
-
212
-
213
-
214
-
215
-
216
-
217
-
218
-
219
-
220
-
221
-
222
-
223
-
224
-
225
-
226
-
227
-
228
-
229
-
230
-
231
-
232
-
233
-
234
-
235
-
236
-
237
-
238
-
239
-
240
-
241
-
242
-
243
-
244
-
245
-
246
-
247
-
248
-
249
-
250
-
251
-
252
-
253
-
254
-
255
-
256
-
257
-
258
-
259
-
260
-
261
-
262
-
263
-
264
-
265
-
266
-
267
-
268
-
269
-
270
-
271
-
272
-
273
-
274
-
275
-
276
-
277
-
278
-
279
-
280
-
281
-
282
-
283
-
284
-
285
-
286
-
287
-
288
-
289
-
290
-
291
-
292
-
293
-
294
-
295
-
296
-
297
-
298
-
299
-
300
-
301
-
302
-
303
-
304
-
305
-
306
-
307
-
308
-
309
-
310
-
311
-
312
-
313
-
314
-
315
-
316
-
317
-
318
-
319
-
320
-
321
-
322
-
323
-
324
-
325
-
326
-
327
-
328
-
329
-
330
-
331
-
332
-
333
-
334
-
335
-
336
-
337
-
338
-
339
-
340
-
341
-
342
-
343
-
344
-
345
-
346
-
347
-
348
-
349
-
350
-
351
-
352
-
353
-
354
-
355
-
356
-
357
-
358
-
359
-
360
-
361
-
362
-
363
-
364
-
365
-
366
-
367
-
368
-
369
-
370
 |
 |

TableofContents
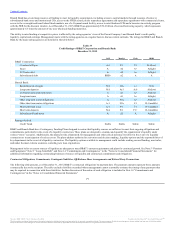
The average annualized cost of interest-bearing deposits was 0.24%, a decline of one basis point compared to the earlier quarter. The average annualized rate
paid on long-term debt was 2.11%, compared to 2.22% for the earlier quarter. This decrease was primarily due to early extinguishments of higher cost FHLB
advances.
Excluding acquired from FDIC and PCI loans, the provision for credit losses was $128 million, compared to $84 million in the earlier quarter. The earlier
quarter included a $24 million allowance release related to the sale of nonperforming mortgage loans, which also resulted in $4 million of net recoveries. Net
charge-offs for the fourth quarter of 2015, excluding loans acquired from the FDIC and PCI, totaled $130 million, compared to $102 million for the earlier
quarter.
The $7 million decrease in noninterest income was driven by lower insurance income, mortgage banking income and investment banking and brokerage fees
and commissions, partially offset by improved FDIC loss share income and higher other income.
Noninterest expense was $1.6 billion for the fourth quarter of 2015, an increase of $203 million compared to the earlier quarter. This increase was primarily
driven by the Susquehanna and The Bank of Kentucky acquisitions, which resulted in higher personnel expense, occupancy and equipment expense, merger-
related and restructuring charges and other expense. These increases were partially offset by a decrease in loan-related expense.
The provision for income taxes was $251 million for the fourth quarter of 2015, compared to $277 million for the earlier quarter. This produced an effective
tax rate for the fourth quarter of 2015 of 31.7%, compared to 31.5% for the earlier quarter.
Reclassifications
In certain circumstances, reclassifications have been made to prior period information to conform to the current presentation. Such reclassifications had no
effect on previously reported shareholders’ equity or net income.
Critical Accounting Policies
The accounting and reporting policies of BB&T are in accordance with GAAP and conform to the accounting and reporting guidelines prescribed by bank
regulatory authorities. The financial position and results of operations are affected by management’s application of accounting policies, including estimates,
assumptions and judgments made to arrive at the carrying value of assets and liabilities and amounts reported for revenues and expenses. Different
assumptions in the application of these policies could result in material changes in the consolidated financial position and/or consolidated results of
operations and related disclosures. Understanding BB&T’s accounting policies is fundamental to understanding the consolidated financial position and
consolidated results of operations. Accordingly, BB&T’s significant accounting policies and changes in accounting principles and effects of new accounting
pronouncements are discussed in detail in Note 1 “Summary of Significant Accounting Policies” in the “Notes to Consolidated Financial Statements.”
The following is a summary of BB&T’s critical accounting policies that are highly dependent on estimates, assumptions and judgments. These critical
accounting policies are reviewed with the Audit Committee of the Board of Directors on a periodic basis.
ACL
BB&T’s policy is to maintain an ALLL and a RUFC that represent management’s best estimate of probable credit losses inherent in the loan and lease
portfolios and off-balance sheet lending commitments at the balance sheet date. Estimates for loan and lease losses are determined by analyzing historical
loan and lease losses, historical loan and lease migration to charge-off experience, current trends in delinquencies and charge-offs, expected cash flows on
purchased loans, current assessment of problem loans and leases, the results of regulatory examinations and changes in the size, composition and risk
assessment of the loan and lease portfolio. As part of this process, BB&T develops a series of loss estimate factors, which are modeled projections of the
frequency, timing and severity of losses. These loss estimate factors are based on historical loss experience, economic and political environmental
considerations and any other data that management believes will provide evidence about the expected collectability of outstanding loan and lease amounts.
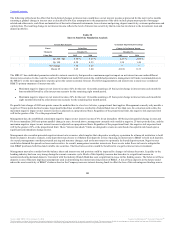
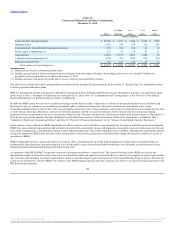
The following table summarizes the loss estimate factors used to determine the ALLL:
Loss Estimate Factor Description
Loss Frequency Indicates the likelihood of a borrower defaulting on a loan
Loss Severity Indicates the amount of estimated loss at the time of default
76
Source: BB&T CORP, 10-K, February 25, 2016 Powered by Morningstar® Document Research℠
The information contained herein may not be copied, adapted or distributed and is not warranted to be accurate, complete or timely. The user assumes all risks for any damages or losses arising from any use of this information,
except to the extent such damages or losses cannot be limited or excluded by applicable law. Past financial performance is no guarantee of future results.