BB&T 2015 Annual Report Download - page 150
Download and view the complete annual report
Please find page 150 of the 2015 BB&T annual report below. You can navigate through the pages in the report by either clicking on the pages listed below, or by using the keyword search tool below to find specific information within the annual report.-
 1
1 -
2
-
3
-
4
-
5
-
6
-
7
-
8
-
9
-
10
-
11
-
12
-
13
-
14
-
15
-
16
-
17
-
18
-
19
-
20
-
21
-
22
-
23
-
24
-
25
-
26
-
27
-
28
-
29
-
30
-
31
-
32
-
33
-
34
-
35
-
36
-
37
-
38
-
39
-
40
-
41
-
42
-
43
-
44
-
45
-
46
-
47
-
48
-
49
-
50
-
51
-
52
-
53
-
54
-
55
-
56
-
57
-
58
-
59
-
60
-
61
-
62
-
63
-
64
-
65
-
66
-
67
-
68
-
69
-
70
-
71
-
72
-
73
-
74
-
75
-
76
-
77
-
78
-
79
-
80
-
81
-
82
-
83
-
84
-
85
-
86
-
87
-
88
-
89
-
90
-
91
-
92
-
93
-
94
-
95
-
96
-
97
-
98
-
99
-
100
-
101
-
102
-
103
-
104
-
105
-
106
-
107
-
108
-
109
-
110
-
111
-
112
-
113
-
114
-
115
-
116
-
117
-
118
-
119
-
120
-
121
-
122
-
123
-
124
-
125
-
126
-
127
-
128
-
129
-
130
-
131
-
132
-
133
-
134
-
135
-
136
-
137
-
138
-
139
-
 140
140 -
 141
141 -
 142
142 -
 143
143 -
 144
144 -
 145
145 -
 146
146 -
 147
147 -
 148
148 -
 149
149 -
 150
150 -
 151
151 -
 152
152 -
 153
153 -
 154
154 -
 155
155 -
 156
156 -
 157
157 -
 158
158 -
 159
159 -
 160
160 -
161
-
162
-
163
-
164
-
165
-
166
-
167
-
168
-
169
-
170
-
171
-
172
-
173
-
174
-
175
-
176
-
177
-
178
-
179
-
180
-
181
-
182
-
183
-
184
-
185
-
186
-
187
-
188
-
189
-
190
-
191
-
192
-
193
-
194
-
195
-
196
-
197
-
198
-
199
-
200
-
201
-
202
-
203
-
204
-
205
-
206
-
207
-
208
-
209
-
210
-
211
-
212
-
213
-
214
-
215
-
216
-
217
-
218
-
219
-
220
-
221
-
222
-
223
-
224
-
225
-
226
-
227
-
228
-
229
-
230
-
231
-
232
-
233
-
234
-
235
-
236
-
237
-
238
-
239
-
240
-
241
-
242
-
243
-
244
-
245
-
246
-
247
-
248
-
249
-
250
-
251
-
252
-
253
-
254
-
255
-
256
-
257
-
258
-
259
-
260
-
261
-
262
-
263
-
264
-
265
-
266
-
267
-
268
-
269
-
270
-
271
-
272
-
273
-
274
-
275
-
276
-
277
-
278
-
279
-
280
-
281
-
282
-
283
-
284
-
285
-
286
-
287
-
288
-
289
-
290
-
291
-
292
-
293
-
294
-
295
-
296
-
297
-
298
-
299
-
300
-
301
-
302
-
303
-
304
-
305
-
306
-
307
-
308
-
309
-
310
-
311
-
312
-
313
-
314
-
315
-
316
-
317
-
318
-
319
-
320
-
321
-
322
-
323
-
324
-
325
-
326
-
327
-
328
-
329
-
330
-
331
-
332
-
333
-
334
-
335
-
336
-
337
-
338
-
339
-
340
-
341
-
342
-
343
-
344
-
345
-
346
-
347
-
348
-
349
-
350
-
351
-
352
-
353
-
354
-
355
-
356
-
357
-
358
-
359
-
360
-
361
-
362
-
363
-
364
-
365
-
366
-
367
-
368
-
369
-
370
 |
 |

TableofContents
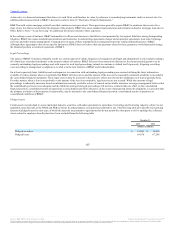
Deposit liabilities: The fair values for demand deposits are equal to the amount payable on demand. Fair values for CDs are estimated using a discounted
cash flow calculation that applies current interest rates to aggregate expected maturities. BB&T has developed long-term relationships with its deposit
customers, commonly referred to as CDIs, that have not been considered in the determination of the deposit liabilities’ fair value.
Short-term borrowings: The carrying amounts of short-term borrowings, excluding securities sold short, approximate their fair values.
Long-term debt: The fair values of long-term debt instruments are estimated based on quoted market prices for the instrument if available, or for similar
instruments if not available, or by using discounted cash flow analyses, based on current incremental borrowing rates for similar types of instruments.
Contractual commitments: The fair values of commitments are estimated using the fees charged to enter into similar agreements, taking into account the
remaining terms of the agreements and the present creditworthiness of the counterparties. The fair values of guarantees and letters of credit are estimated
based on the counterparties’ creditworthiness and average default rates for loan products with similar risks. These respective fair value measurements are
categorized within Level 3 of the fair value hierarchy. Retail lending commitments are assigned no fair value as BB&T typically has the ability to cancel
such commitments by providing notice to the borrower.
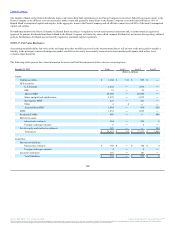
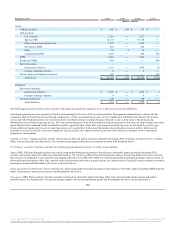
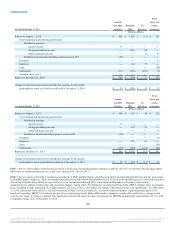
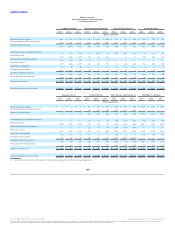
Financial assets and liabilities not recorded at fair value are summarized below:
Financial assets:
HTM securities $ 18,530 $ 18,519 $ 18,519 $ ―
Loans and leases HFI, net of ALLL 134,491 134,728 ― 134,728
FDIC loss share receivable 285 11 ― 11
Financial liabilities:
Deposits 149,124 149,300 149,300 ―
FDIC loss share payable 685 676 ― 676
Long-term debt 23,769 24,206 24,206 ―
Financial assets:
HTM securities $ 20,240 $ 20,313 $ 20,313 $ ―
Loans and leases HFI, net of ALLL 118,410 118,605 ― 118,605
FDIC loss share receivable 534 123 ― 123
Financial liabilities:
Deposits 129,040 129,259 129,259 ―
FDIC loss share payable 697 696 ― 696
Long-term debt 23,312 24,063 24,063 ―
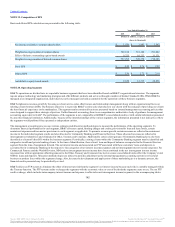
The following is a summary of selected information pertaining to off-balance sheet financial instruments:
Commitments to extend, originate or purchase credit $ 59,019 $ 253 $ 49,333 $ 238
Residential mortgage loans sold with recourse 702 8 667 9
Other loans sold with recourse 4,198 7 4,264 7
Letters of credit 3,033 27 3,462 22
137
Source: BB&T CORP, 10-K, February 25, 2016 Powered by Morningstar® Document Research℠
The information contained herein may not be copied, adapted or distributed and is not warranted to be accurate, complete or timely. The user assumes all risks for any damages or losses arising from any use of this information,
except to the extent such damages or losses cannot be limited or excluded by applicable law. Past financial performance is no guarantee of future results.