BB&T 2015 Annual Report Download - page 159
Download and view the complete annual report
Please find page 159 of the 2015 BB&T annual report below. You can navigate through the pages in the report by either clicking on the pages listed below, or by using the keyword search tool below to find specific information within the annual report.-
 1
1 -
2
-
3
-
4
-
5
-
6
-
7
-
8
-
9
-
10
-
11
-
12
-
13
-
14
-
15
-
16
-
17
-
18
-
19
-
20
-
21
-
22
-
23
-
24
-
25
-
26
-
27
-
28
-
29
-
30
-
31
-
32
-
33
-
34
-
35
-
36
-
37
-
38
-
39
-
40
-
41
-
42
-
43
-
44
-
45
-
46
-
47
-
48
-
49
-
50
-
51
-
52
-
53
-
54
-
55
-
56
-
57
-
58
-
59
-
60
-
61
-
62
-
63
-
64
-
65
-
66
-
67
-
68
-
69
-
70
-
71
-
72
-
73
-
74
-
75
-
76
-
77
-
78
-
79
-
80
-
81
-
82
-
83
-
84
-
85
-
86
-
87
-
88
-
89
-
90
-
91
-
92
-
93
-
94
-
95
-
96
-
97
-
98
-
99
-
100
-
101
-
102
-
103
-
104
-
105
-
106
-
107
-
108
-
109
-
110
-
111
-
112
-
113
-
114
-
115
-
116
-
117
-
118
-
119
-
120
-
121
-
122
-
123
-
124
-
125
-
126
-
127
-
128
-
129
-
130
-
131
-
132
-
133
-
134
-
135
-
136
-
137
-
138
-
139
-
140
-
141
-
142
-
143
-
144
-
145
-
146
-
147
-
148
-
 149
149 -
 150
150 -
 151
151 -
 152
152 -
 153
153 -
 154
154 -
 155
155 -
 156
156 -
 157
157 -
 158
158 -
 159
159 -
 160
160 -
 161
161 -
 162
162 -
 163
163 -
 164
164 -
 165
165 -
 166
166 -
 167
167 -
 168
168 -
 169
169 -
170
-
171
-
172
-
173
-
174
-
175
-
176
-
177
-
178
-
179
-
180
-
181
-
182
-
183
-
184
-
185
-
186
-
187
-
188
-
189
-
190
-
191
-
192
-
193
-
194
-
195
-
196
-
197
-
198
-
199
-
200
-
201
-
202
-
203
-
204
-
205
-
206
-
207
-
208
-
209
-
210
-
211
-
212
-
213
-
214
-
215
-
216
-
217
-
218
-
219
-
220
-
221
-
222
-
223
-
224
-
225
-
226
-
227
-
228
-
229
-
230
-
231
-
232
-
233
-
234
-
235
-
236
-
237
-
238
-
239
-
240
-
241
-
242
-
243
-
244
-
245
-
246
-
247
-
248
-
249
-
250
-
251
-
252
-
253
-
254
-
255
-
256
-
257
-
258
-
259
-
260
-
261
-
262
-
263
-
264
-
265
-
266
-
267
-
268
-
269
-
270
-
271
-
272
-
273
-
274
-
275
-
276
-
277
-
278
-
279
-
280
-
281
-
282
-
283
-
284
-
285
-
286
-
287
-
288
-
289
-
290
-
291
-
292
-
293
-
294
-
295
-
296
-
297
-
298
-
299
-
300
-
301
-
302
-
303
-
304
-
305
-
306
-
307
-
308
-
309
-
310
-
311
-
312
-
313
-
314
-
315
-
316
-
317
-
318
-
319
-
320
-
321
-
322
-
323
-
324
-
325
-
326
-
327
-
328
-
329
-
330
-
331
-
332
-
333
-
334
-
335
-
336
-
337
-
338
-
339
-
340
-
341
-
342
-
343
-
344
-
345
-
346
-
347
-
348
-
349
-
350
-
351
-
352
-
353
-
354
-
355
-
356
-
357
-
358
-
359
-
360
-
361
-
362
-
363
-
364
-
365
-
366
-
367
-
368
-
369
-
370
 |
 |

TableofContents
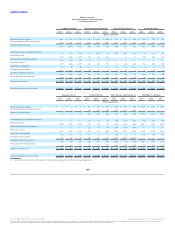
Net interest income (expense) $ 1,801 $ 1,726 $ 1,712 $ 1,357 $ 1,482 $ 1,584 $ 881 $ 835 $ 834 $ 648 $ 575 $ 676
Net intersegment interest income (expense) 1,272 1,188 1,336 (905) (984) (999) (153) (160) (158) (236) (205) (140)
Segment net interest income 3,073 2,914 3,048 452 498 585 728 675 676 412 370 536
Allocated provision for loan and lease losses 67 123 279 9 (107) 12 254 237 214 43 36 83
Noninterest income 1,166 1,184 1,180 355 310 481 7 2 5 260 222 222
Intersegment net referral fees (expense) 135 120 178 2 2 2 ― ― ― ― ― ―
Noninterest expense 1,517 1,428 1,573 321 498 357 151 114 106 254 210 243
Amortization of intangibles 23 29 36 ― ― ― ― ― ― 4 5 5
Allocated corporate expenses 1,225 1,204 1,123 93 91 81 39 31 31 63 62 69
Income (loss) before income taxes 1,542 1,434 1,395 386 328 618 291 295 330 308 279 358
Provision (benefit) for income taxes 564 524 511 146 124 235 111 112 126 74 64 92
Segment net income (loss) $ 978 $ 910 $ 884 $ 240 $ 204 $ 383 $ 180 $ 183 $ 204 $ 234 $ 215 $ 266
Identifiable segment assets (period end) $ 68,245 $ 55,495 $ 55,667 $ 33,407 $ 34,463 $ 36,083 $ 15,130 $ 12,821 $ 11,525 $ 18,222 $ 15,641 $ 15,993
Net interest income (expense) $ 2 $ 2 $ 3 $ 217 $ 187 $ 169 $ 686 $ 567 $ 638 $ 5,592 $ 5,374 $ 5,616
Net intersegment interest income (expense) 7 6 6 312 262 295 (297) (107) (340) ― ― ―
Segment net interest income 9 8 9 529 449 464 389 460 298 5,592 5,374 5,616
Allocated provision for loan and lease losses ― ― ― 65 26 20 (10) (64) (16) 428 251 592
Noninterest income 1,608 1,663 1,535 847 779 757 (224) (304) (144) 4,019 3,856 4,036
Intersegment net referral fees (expense) ― ― ― 22 15 16 (159) (137) (196) ― ― ―
Noninterest expense 1,191 1,189 1,135 682 635 606 2,045 1,687 1,651 6,161 5,761 5,671
Amortization of intangibles 47 53 61 3 2 3 28 2 1 105 91 106
Allocated corporate expenses 99 86 64 136 127 109 (1,655) (1,601) (1,477) ― ― ―
Income (loss) before income taxes 280 343 284 512 453 499 (402) (5) (201) 2,917 3,127 3,283
Provision (benefit) for income taxes 98 110 97 193 170 187 (392) (183) 305 794 921 1,553
Segment net income (loss) $ 182 $ 233 $ 187 $ 319 $ 283 $ 312 $ (10) $ 178 $ (506) $ 2,123 $ 2,206 $ 1,730
Identifiable segment assets (period end) $ 2,804 $ 2,965 $ 2,990 $ 16,429 $ 12,887 $ 10,572 $ 55,710 $ 52,562 $ 50,213 $ 209,947 $ 186,834 $ 183,043
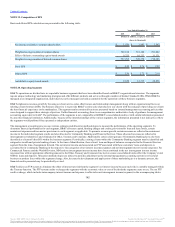
(1) Includes financial data from subsidiaries below the quantitative and qualitative thresholds requiring disclosure.
146
Source: BB&T CORP, 10-K, February 25, 2016 Powered by Morningstar® Document Research℠
The information contained herein may not be copied, adapted or distributed and is not warranted to be accurate, complete or timely. The user assumes all risks for any damages or losses arising from any use of this information,
except to the extent such damages or losses cannot be limited or excluded by applicable law. Past financial performance is no guarantee of future results.