BB&T 2015 Annual Report Download - page 123
Download and view the complete annual report
Please find page 123 of the 2015 BB&T annual report below. You can navigate through the pages in the report by either clicking on the pages listed below, or by using the keyword search tool below to find specific information within the annual report.-
 1
1 -
2
-
3
-
4
-
5
-
6
-
7
-
8
-
9
-
10
-
11
-
12
-
13
-
14
-
15
-
16
-
17
-
18
-
19
-
20
-
21
-
22
-
23
-
24
-
25
-
26
-
27
-
28
-
29
-
30
-
31
-
32
-
33
-
34
-
35
-
36
-
37
-
38
-
39
-
40
-
41
-
42
-
43
-
44
-
45
-
46
-
47
-
48
-
49
-
50
-
51
-
52
-
53
-
54
-
55
-
56
-
57
-
58
-
59
-
60
-
61
-
62
-
63
-
64
-
65
-
66
-
67
-
68
-
69
-
70
-
71
-
72
-
73
-
74
-
75
-
76
-
77
-
78
-
79
-
80
-
81
-
82
-
83
-
84
-
85
-
86
-
87
-
88
-
89
-
90
-
91
-
92
-
93
-
94
-
95
-
96
-
97
-
98
-
99
-
100
-
101
-
102
-
103
-
104
-
105
-
106
-
107
-
108
-
109
-
110
-
111
-
112
-
 113
113 -
 114
114 -
 115
115 -
 116
116 -
 117
117 -
 118
118 -
 119
119 -
 120
120 -
 121
121 -
 122
122 -
 123
123 -
 124
124 -
 125
125 -
 126
126 -
 127
127 -
 128
128 -
 129
129 -
 130
130 -
 131
131 -
 132
132 -
 133
133 -
134
-
135
-
136
-
137
-
138
-
139
-
140
-
141
-
142
-
143
-
144
-
145
-
146
-
147
-
148
-
149
-
150
-
151
-
152
-
153
-
154
-
155
-
156
-
157
-
158
-
159
-
160
-
161
-
162
-
163
-
164
-
165
-
166
-
167
-
168
-
169
-
170
-
171
-
172
-
173
-
174
-
175
-
176
-
177
-
178
-
179
-
180
-
181
-
182
-
183
-
184
-
185
-
186
-
187
-
188
-
189
-
190
-
191
-
192
-
193
-
194
-
195
-
196
-
197
-
198
-
199
-
200
-
201
-
202
-
203
-
204
-
205
-
206
-
207
-
208
-
209
-
210
-
211
-
212
-
213
-
214
-
215
-
216
-
217
-
218
-
219
-
220
-
221
-
222
-
223
-
224
-
225
-
226
-
227
-
228
-
229
-
230
-
231
-
232
-
233
-
234
-
235
-
236
-
237
-
238
-
239
-
240
-
241
-
242
-
243
-
244
-
245
-
246
-
247
-
248
-
249
-
250
-
251
-
252
-
253
-
254
-
255
-
256
-
257
-
258
-
259
-
260
-
261
-
262
-
263
-
264
-
265
-
266
-
267
-
268
-
269
-
270
-
271
-
272
-
273
-
274
-
275
-
276
-
277
-
278
-
279
-
280
-
281
-
282
-
283
-
284
-
285
-
286
-
287
-
288
-
289
-
290
-
291
-
292
-
293
-
294
-
295
-
296
-
297
-
298
-
299
-
300
-
301
-
302
-
303
-
304
-
305
-
306
-
307
-
308
-
309
-
310
-
311
-
312
-
313
-
314
-
315
-
316
-
317
-
318
-
319
-
320
-
321
-
322
-
323
-
324
-
325
-
326
-
327
-
328
-
329
-
330
-
331
-
332
-
333
-
334
-
335
-
336
-
337
-
338
-
339
-
340
-
341
-
342
-
343
-
344
-
345
-
346
-
347
-
348
-
349
-
350
-
351
-
352
-
353
-
354
-
355
-
356
-
357
-
358
-
359
-
360
-
361
-
362
-
363
-
364
-
365
-
366
-
367
-
368
-
369
-
370
 |
 |

TableofContents
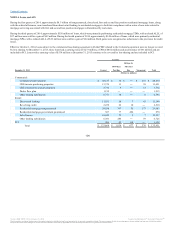
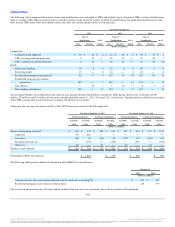
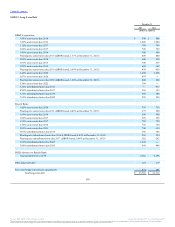
A summary of premises and equipment is presented in the accompanying table:
Land and land improvements $ 596 $ 533
Buildings and building improvements 40 1,503 1,431
Furniture and equipment 5 - 10 1,030 986
Leasehold improvements 721 670
Construction in progress 122 47
Capitalized leases on premises and equipment 67 61
Total 4,039 3,728
Accumulated depreciation and amortization (2,032) (1,901)
Net premises and equipment $ 2,007 $ 1,827
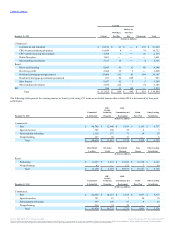
The following table excludes assets related to BB&T's lease financing business.
Rent expense applicable to operating leases $ 245 $ 227 $ 230
Rental income from owned properties and subleases 7 7 8
Future minimum lease payments for operating leases $ 250 $ 229 $ 200 $ 175 $ 147 $ 591
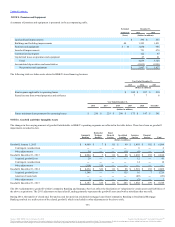
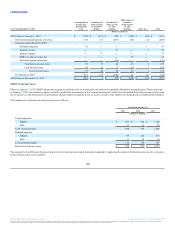
The changes in the carrying amounts of goodwill attributable to BB&T’s operating segments are reflected in the table below. There have been no goodwill
impairments recorded to date.
Goodwill, January 1, 2013 $ 4,900 $ 7 $ 111 $ 99 $ 1,495 $ 192 $ 6,804
Contingent consideration ― ― ― ― 6 ― 6
Other adjustments 24 ― ― (11) (9) ― 4
Goodwill, December 31, 2013 $ 4,924 $ 7 $ 111 $ 88 $ 1,492 $ 192 $ 6,814
Acquired goodwill, net 29 ― ― ― 12 ― 41
Contingent consideration ― ― ― ― 14 ― 14
Other adjustments (319) 319 ― ― ― ― ―
Goodwill, December 31, 2014 $ 4,634 $ 326 $ 111 $ 88 $ 1,518 $ 192 $ 6,869
Acquired goodwill, net 1,548 ― ― 155 16 7 1,726
American Coastal sale ― ― ― ― (49) ― (49)
Other adjustments 5 ― ― ― (3) ― 2
Goodwill, December 31, 2015 $ 6,187 $ 326 $ 111 $ 243 $ 1,482 $ 199 $ 8,548
The 2013 adjustments to goodwill within Community Banking and Insurance Services reflect the finalization of valuations for certain assets and liabilities of
the above acquisitions. The 2013 adjustment to Specialized Lending primarily represents the goodwill associated with a subsidiary that was sold.
During 2014, the transfer of closed-end, first and second lien position residential mortgage loans from Community Banking to Residential Mortgage
Banking resulted in a reallocation of the related goodwill, which is included in other adjustments in the above table.
111
Source: BB&T CORP, 10-K, February 25, 2016 Powered by Morningstar® Document Research℠
The information contained herein may not be copied, adapted or distributed and is not warranted to be accurate, complete or timely. The user assumes all risks for any damages or losses arising from any use of this information,
except to the extent such damages or losses cannot be limited or excluded by applicable law. Past financial performance is no guarantee of future results.