BB&T 2015 Annual Report Download - page 125
Download and view the complete annual report
Please find page 125 of the 2015 BB&T annual report below. You can navigate through the pages in the report by either clicking on the pages listed below, or by using the keyword search tool below to find specific information within the annual report.-
 1
1 -
2
-
3
-
4
-
5
-
6
-
7
-
8
-
9
-
10
-
11
-
12
-
13
-
14
-
15
-
16
-
17
-
18
-
19
-
20
-
21
-
22
-
23
-
24
-
25
-
26
-
27
-
28
-
29
-
30
-
31
-
32
-
33
-
34
-
35
-
36
-
37
-
38
-
39
-
40
-
41
-
42
-
43
-
44
-
45
-
46
-
47
-
48
-
49
-
50
-
51
-
52
-
53
-
54
-
55
-
56
-
57
-
58
-
59
-
60
-
61
-
62
-
63
-
64
-
65
-
66
-
67
-
68
-
69
-
70
-
71
-
72
-
73
-
74
-
75
-
76
-
77
-
78
-
79
-
80
-
81
-
82
-
83
-
84
-
85
-
86
-
87
-
88
-
89
-
90
-
91
-
92
-
93
-
94
-
95
-
96
-
97
-
98
-
99
-
100
-
101
-
102
-
103
-
104
-
105
-
106
-
107
-
108
-
109
-
110
-
111
-
112
-
113
-
114
-
 115
115 -
 116
116 -
 117
117 -
 118
118 -
 119
119 -
 120
120 -
 121
121 -
 122
122 -
 123
123 -
 124
124 -
 125
125 -
 126
126 -
 127
127 -
 128
128 -
 129
129 -
 130
130 -
 131
131 -
 132
132 -
 133
133 -
 134
134 -
 135
135 -
136
-
137
-
138
-
139
-
140
-
141
-
142
-
143
-
144
-
145
-
146
-
147
-
148
-
149
-
150
-
151
-
152
-
153
-
154
-
155
-
156
-
157
-
158
-
159
-
160
-
161
-
162
-
163
-
164
-
165
-
166
-
167
-
168
-
169
-
170
-
171
-
172
-
173
-
174
-
175
-
176
-
177
-
178
-
179
-
180
-
181
-
182
-
183
-
184
-
185
-
186
-
187
-
188
-
189
-
190
-
191
-
192
-
193
-
194
-
195
-
196
-
197
-
198
-
199
-
200
-
201
-
202
-
203
-
204
-
205
-
206
-
207
-
208
-
209
-
210
-
211
-
212
-
213
-
214
-
215
-
216
-
217
-
218
-
219
-
220
-
221
-
222
-
223
-
224
-
225
-
226
-
227
-
228
-
229
-
230
-
231
-
232
-
233
-
234
-
235
-
236
-
237
-
238
-
239
-
240
-
241
-
242
-
243
-
244
-
245
-
246
-
247
-
248
-
249
-
250
-
251
-
252
-
253
-
254
-
255
-
256
-
257
-
258
-
259
-
260
-
261
-
262
-
263
-
264
-
265
-
266
-
267
-
268
-
269
-
270
-
271
-
272
-
273
-
274
-
275
-
276
-
277
-
278
-
279
-
280
-
281
-
282
-
283
-
284
-
285
-
286
-
287
-
288
-
289
-
290
-
291
-
292
-
293
-
294
-
295
-
296
-
297
-
298
-
299
-
300
-
301
-
302
-
303
-
304
-
305
-
306
-
307
-
308
-
309
-
310
-
311
-
312
-
313
-
314
-
315
-
316
-
317
-
318
-
319
-
320
-
321
-
322
-
323
-
324
-
325
-
326
-
327
-
328
-
329
-
330
-
331
-
332
-
333
-
334
-
335
-
336
-
337
-
338
-
339
-
340
-
341
-
342
-
343
-
344
-
345
-
346
-
347
-
348
-
349
-
350
-
351
-
352
-
353
-
354
-
355
-
356
-
357
-
358
-
359
-
360
-
361
-
362
-
363
-
364
-
365
-
366
-
367
-
368
-
369
-
370
 |
 |

TableofContents
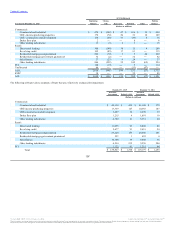
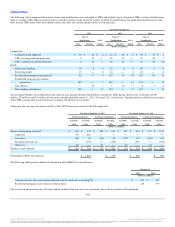
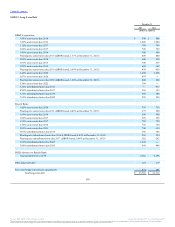
UPB of residential mortgage loans sold from the LHFS portfolio $ 14,764 $ 13,400 $ 28,900
Pre-tax gains recognized on mortgage loans sold and held for sale 148 110 292
Servicing fees recognized from mortgage loans serviced for others 273 275 259
Approximate weighted average servicing fee on the outstanding balance
of residential mortgage loans serviced for others 0.29 % 0.29 % 0.30 %
Weighted average interest rate on mortgage loans serviced for others 4.12 4.20 4.24
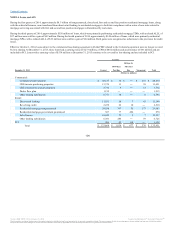
The following table presents a roll forward of the carrying value of residential MSRs recorded at fair value:
Carrying value, January 1, $ 844 $ 1,047 $ 627
Additions 156 141 336
Change in fair value due to changes in valuation inputs or assumptions:
Prepayment speeds 91 (219) 287
Weighted average OAS (52) ― (31)
Servicing costs (25) (2) (29)
Realization of expected net servicing cash flows, passage of time and other (134) (123) (143)
Carrying value, December 31, $ 880 $ 844 $ 1,047
Gains (losses) on derivative financial instruments used to mitigate the
income statement effect of changes in fair value $ 32 $ 251 $ (197)
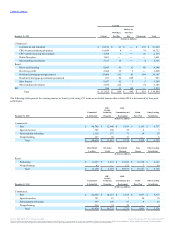
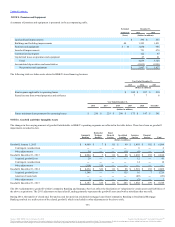
The sensitivity of the fair value of the residential MSRs to changes in key assumptions is included in the accompanying table:
Prepayment speed 8.1 % 9.0 % 8.7 % 10.8 % 12.8 % 12.0 %
Effect on fair value of a 10% increase $ (28) $ (30)
Effect on fair value of a 20% increase (54) (58)
OAS 10.3 % 10.6 % 10.4 % 9.1 % 9.9 % 9.3 %
Effect on fair value of a 10% increase $ (32) $ (26)
Effect on fair value of a 20% increase (61) (50)
Composition of loans serviced for others:
Fixed-rate residential mortgage loans 99.2 % 99.4 %
Adjustable-rate residential mortgage loans 0.8 0.6
Total 100.0 % 100.0 %
Weighted average life 6.8 yrs 5.7 yrs
The sensitivity calculations above are hypothetical and should not be considered to be predictive of future performance. As indicated, changes in fair value
based on adverse changes in assumptions generally cannot be extrapolated because the relationship of the change in assumption to the change in fair value
may not be linear. Also, in the above table, the effect of an adverse variation in a particular assumption on the fair value of the MSRs is calculated without
changing any other assumption; while in reality, changes in one factor may result in changes in another, which may magnify or counteract the effect of the
change.
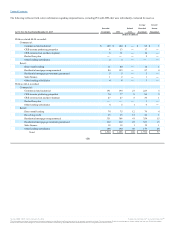
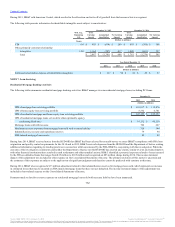
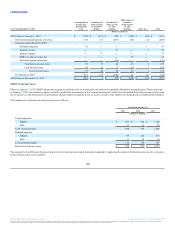
Commercial Mortgage Banking Activities
CRE mortgage loans serviced for others are not included in loans and leases on the accompanying Consolidated Balance Sheets. The following table
summarizes commercial mortgage banking activities for the periods presented:
Source: BB&T CORP, 10-K, February 25, 2016 Powered by Morningstar® Document Research℠
The information contained herein may not be copied, adapted or distributed and is not warranted to be accurate, complete or timely. The user assumes all risks for any damages or losses arising from any use of this information,
except to the extent such damages or losses cannot be limited or excluded by applicable law. Past financial performance is no guarantee of future results.