BB&T 2015 Annual Report Download - page 66
Download and view the complete annual report
Please find page 66 of the 2015 BB&T annual report below. You can navigate through the pages in the report by either clicking on the pages listed below, or by using the keyword search tool below to find specific information within the annual report.-
 1
1 -
2
-
3
-
4
-
5
-
6
-
7
-
8
-
9
-
10
-
11
-
12
-
13
-
14
-
15
-
16
-
17
-
18
-
19
-
20
-
21
-
22
-
23
-
24
-
25
-
26
-
27
-
28
-
29
-
30
-
31
-
32
-
33
-
34
-
35
-
36
-
37
-
38
-
39
-
40
-
41
-
42
-
43
-
44
-
45
-
46
-
47
-
48
-
49
-
50
-
51
-
52
-
53
-
54
-
55
-
 56
56 -
 57
57 -
 58
58 -
 59
59 -
 60
60 -
 61
61 -
 62
62 -
 63
63 -
 64
64 -
 65
65 -
 66
66 -
 67
67 -
 68
68 -
 69
69 -
 70
70 -
 71
71 -
 72
72 -
 73
73 -
 74
74 -
 75
75 -
 76
76 -
77
-
78
-
79
-
80
-
81
-
82
-
83
-
84
-
85
-
86
-
87
-
88
-
89
-
90
-
91
-
92
-
93
-
94
-
95
-
96
-
97
-
98
-
99
-
100
-
101
-
102
-
103
-
104
-
105
-
106
-
107
-
108
-
109
-
110
-
111
-
112
-
113
-
114
-
115
-
116
-
117
-
118
-
119
-
120
-
121
-
122
-
123
-
124
-
125
-
126
-
127
-
128
-
129
-
130
-
131
-
132
-
133
-
134
-
135
-
136
-
137
-
138
-
139
-
140
-
141
-
142
-
143
-
144
-
145
-
146
-
147
-
148
-
149
-
150
-
151
-
152
-
153
-
154
-
155
-
156
-
157
-
158
-
159
-
160
-
161
-
162
-
163
-
164
-
165
-
166
-
167
-
168
-
169
-
170
-
171
-
172
-
173
-
174
-
175
-
176
-
177
-
178
-
179
-
180
-
181
-
182
-
183
-
184
-
185
-
186
-
187
-
188
-
189
-
190
-
191
-
192
-
193
-
194
-
195
-
196
-
197
-
198
-
199
-
200
-
201
-
202
-
203
-
204
-
205
-
206
-
207
-
208
-
209
-
210
-
211
-
212
-
213
-
214
-
215
-
216
-
217
-
218
-
219
-
220
-
221
-
222
-
223
-
224
-
225
-
226
-
227
-
228
-
229
-
230
-
231
-
232
-
233
-
234
-
235
-
236
-
237
-
238
-
239
-
240
-
241
-
242
-
243
-
244
-
245
-
246
-
247
-
248
-
249
-
250
-
251
-
252
-
253
-
254
-
255
-
256
-
257
-
258
-
259
-
260
-
261
-
262
-
263
-
264
-
265
-
266
-
267
-
268
-
269
-
270
-
271
-
272
-
273
-
274
-
275
-
276
-
277
-
278
-
279
-
280
-
281
-
282
-
283
-
284
-
285
-
286
-
287
-
288
-
289
-
290
-
291
-
292
-
293
-
294
-
295
-
296
-
297
-
298
-
299
-
300
-
301
-
302
-
303
-
304
-
305
-
306
-
307
-
308
-
309
-
310
-
311
-
312
-
313
-
314
-
315
-
316
-
317
-
318
-
319
-
320
-
321
-
322
-
323
-
324
-
325
-
326
-
327
-
328
-
329
-
330
-
331
-
332
-
333
-
334
-
335
-
336
-
337
-
338
-
339
-
340
-
341
-
342
-
343
-
344
-
345
-
346
-
347
-
348
-
349
-
350
-
351
-
352
-
353
-
354
-
355
-
356
-
357
-
358
-
359
-
360
-
361
-
362
-
363
-
364
-
365
-
366
-
367
-
368
-
369
-
370
 |
 |

TableofContents
Funding Activities
Deposits are the primary source of funds for lending and investing activities. Scheduled payments, as well as prepayments, and maturities from portfolios of
loans and investment securities also provide a stable source of funds. FHLB advances, other secured borrowings, Federal funds purchased and other short-
term borrowed funds, as well as long-term debt issued through the capital markets, all provide supplemental liquidity sources. Funding activities are
monitored and governed through BB&T’s overall asset/liability management process, which is further discussed in the “Market Risk Management” section
in “Management’s Discussion and Analysis of Financial Condition and Results of Operations” herein. The following section provides a brief description of
the various sources of funds.
Deposits
Deposits are attracted principally from clients within BB&T’s branch network through the offering of a broad selection of deposit instruments to individuals
and businesses, including noninterest-bearing checking accounts, interest-bearing checking accounts, savings accounts, money market deposit accounts,
CDs and IRAs. Deposit account terms vary with respect to the minimum balance required, the time period the funds must remain on deposit and service
charge schedules. Interest rates paid on specific deposit types are determined based on (i) the interest rates offered by competitors, (ii) the anticipated amount
and timing of funding needs, (iii) the availability and cost of alternative sources of funding, and (iv) anticipated future economic conditions and interest
rates. Deposits are attractive sources of funding because of their stability and relative cost. Deposits are regarded as an important part of the overall client
relationship and provide opportunities to cross-sell other BB&T services.
Total deposits were $149.1 billion at December 31, 2015, an increase of $20.1 billion compared to year-end 2014. This increase was driven by acquisition
activity and organic growth. Noninterest-bearing deposits totaled $45.7 billion at December 31, 2015, an increase of $6.9 billion from December 31, 2014.
The majority of the increase in noninterest-bearing deposits was due to business and personal deposits, which grew $4.1 billion (16.1%) and $2.7 billion
(29.0%), respectively.
Interest checking increased $5.1 billion and money market and savings increased $9.9 billion during 2015, while time deposits and IRAs decreased $1.8
billion during 2015.
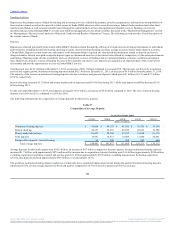
For the year ended December 31, 2015, total deposits averaged $138.5 billion, an increase of $9.4 billion compared to 2014. The cost of interest-bearing
deposits was 0.24% for 2015, compared to 0.26% for 2014.
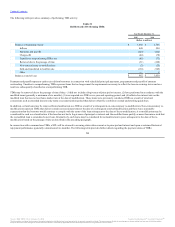
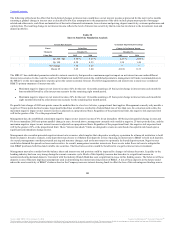
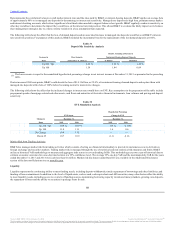
The following table presents the composition of average deposits for the last five quarters:
Noninterest-bearing deposits $ 45,824 $ 44,153 $ 41,502 $ 39,701 $ 39,130
Interest checking 24,157 22,593 20,950 20,623 19,308
Money market and savings 61,431 59,306 53,852 51,644 51,176
Time deposits 16,981 16,837 14,800 17,000 20,041
Foreign office deposits - interest-bearing 98 948 764 563 660
Total average deposits $ 148,491 $ 143,837 $ 131,868 $ 129,531 $ 130,315
Average deposits for the fourth quarter were $148.5 billion, an increase of $4.7 billion compared to the prior quarter. Average noninterest-bearing deposits
increased $1.7 billion, with approximately $870 million of the increase due to acquisitions. Interest checking grew $1.6 billion (approximately $220 million
excluding acquisitions) and money market and savings grew $2.1 billion (approximately $535 million excluding acquisitions). Excluding acquisition
activity, time deposits declined approximately $650 million, or an annualized 18.5%.
The growth in noninterest-bearing deposits and lower-cost deposits drove continued improvement in mix during the quarter. Noninterest-bearing deposits
represented 30.9% of total average deposits for the fourth quarter, compared to 30.7% for the prior quarter and 30.0% a year ago.
59
Source: BB&T CORP, 10-K, February 25, 2016 Powered by Morningstar® Document Research℠
The information contained herein may not be copied, adapted or distributed and is not warranted to be accurate, complete or timely. The user assumes all risks for any damages or losses arising from any use of this information,
except to the extent such damages or losses cannot be limited or excluded by applicable law. Past financial performance is no guarantee of future results.