BB&T 2015 Annual Report Download - page 56
Download and view the complete annual report
Please find page 56 of the 2015 BB&T annual report below. You can navigate through the pages in the report by either clicking on the pages listed below, or by using the keyword search tool below to find specific information within the annual report.-
 1
1 -
2
-
3
-
4
-
5
-
6
-
7
-
8
-
9
-
10
-
11
-
12
-
13
-
14
-
15
-
16
-
17
-
18
-
19
-
20
-
21
-
22
-
23
-
24
-
25
-
26
-
27
-
28
-
29
-
30
-
31
-
32
-
33
-
34
-
35
-
36
-
37
-
38
-
39
-
40
-
41
-
42
-
43
-
44
-
45
-
 46
46 -
 47
47 -
 48
48 -
 49
49 -
 50
50 -
 51
51 -
 52
52 -
 53
53 -
 54
54 -
 55
55 -
 56
56 -
 57
57 -
 58
58 -
 59
59 -
 60
60 -
 61
61 -
 62
62 -
 63
63 -
 64
64 -
 65
65 -
 66
66 -
67
-
68
-
69
-
70
-
71
-
72
-
73
-
74
-
75
-
76
-
77
-
78
-
79
-
80
-
81
-
82
-
83
-
84
-
85
-
86
-
87
-
88
-
89
-
90
-
91
-
92
-
93
-
94
-
95
-
96
-
97
-
98
-
99
-
100
-
101
-
102
-
103
-
104
-
105
-
106
-
107
-
108
-
109
-
110
-
111
-
112
-
113
-
114
-
115
-
116
-
117
-
118
-
119
-
120
-
121
-
122
-
123
-
124
-
125
-
126
-
127
-
128
-
129
-
130
-
131
-
132
-
133
-
134
-
135
-
136
-
137
-
138
-
139
-
140
-
141
-
142
-
143
-
144
-
145
-
146
-
147
-
148
-
149
-
150
-
151
-
152
-
153
-
154
-
155
-
156
-
157
-
158
-
159
-
160
-
161
-
162
-
163
-
164
-
165
-
166
-
167
-
168
-
169
-
170
-
171
-
172
-
173
-
174
-
175
-
176
-
177
-
178
-
179
-
180
-
181
-
182
-
183
-
184
-
185
-
186
-
187
-
188
-
189
-
190
-
191
-
192
-
193
-
194
-
195
-
196
-
197
-
198
-
199
-
200
-
201
-
202
-
203
-
204
-
205
-
206
-
207
-
208
-
209
-
210
-
211
-
212
-
213
-
214
-
215
-
216
-
217
-
218
-
219
-
220
-
221
-
222
-
223
-
224
-
225
-
226
-
227
-
228
-
229
-
230
-
231
-
232
-
233
-
234
-
235
-
236
-
237
-
238
-
239
-
240
-
241
-
242
-
243
-
244
-
245
-
246
-
247
-
248
-
249
-
250
-
251
-
252
-
253
-
254
-
255
-
256
-
257
-
258
-
259
-
260
-
261
-
262
-
263
-
264
-
265
-
266
-
267
-
268
-
269
-
270
-
271
-
272
-
273
-
274
-
275
-
276
-
277
-
278
-
279
-
280
-
281
-
282
-
283
-
284
-
285
-
286
-
287
-
288
-
289
-
290
-
291
-
292
-
293
-
294
-
295
-
296
-
297
-
298
-
299
-
300
-
301
-
302
-
303
-
304
-
305
-
306
-
307
-
308
-
309
-
310
-
311
-
312
-
313
-
314
-
315
-
316
-
317
-
318
-
319
-
320
-
321
-
322
-
323
-
324
-
325
-
326
-
327
-
328
-
329
-
330
-
331
-
332
-
333
-
334
-
335
-
336
-
337
-
338
-
339
-
340
-
341
-
342
-
343
-
344
-
345
-
346
-
347
-
348
-
349
-
350
-
351
-
352
-
353
-
354
-
355
-
356
-
357
-
358
-
359
-
360
-
361
-
362
-
363
-
364
-
365
-
366
-
367
-
368
-
369
-
370
 |
 |

TableofContents
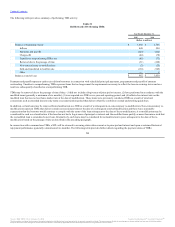
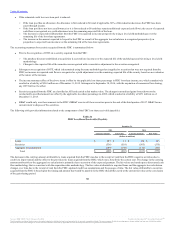
The following table presents the changes in NPAs (excludes foreclosed property acquired from the FDIC):
Balance at beginning of year $ 726 $ 1,053
New NPAs 1,266 1,307
Advances and principal increases 85 74
Disposals of foreclosed assets (1) (484) (487)
Disposals of NPLs (2) (165) (332)
Charge-offs and losses (246) (309)
Payments (358) (398)
Transfers to performing status (149) (192)
Other, net 11 10
Balance at end of year $ 686 $ 726
(1) Includes charge-offs and losses recorded upon sale of $170 million and $165 million for the year ended December 31, 2015 and 2014, respectively.
(2) Includes charge-offs and losses recorded upon sale of $17 million and $25 million for the year ended December 31, 2015 and 2014, respectively.
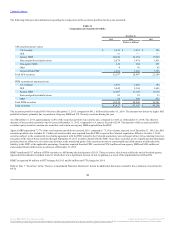
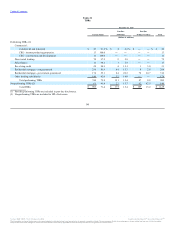
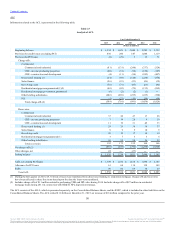
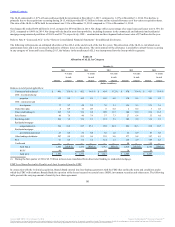
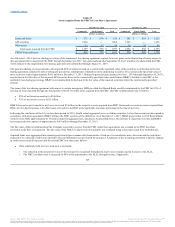
The following tables summarize asset quality information for the past five years. As more fully described below, this information has been adjusted to
exclude certain components:
·BB&T has recorded certain amounts related to government guaranteed GNMA mortgage loans that BB&T has the option, but not the
obligation, to repurchase and has effectively regained control. These amounts are reported in the Consolidated Balance Sheets but have
been excluded from the asset quality disclosures, as management believes they result in distortion of the reported metrics. The amount of
government guaranteed GNMA mortgage loans that have been excluded are noted in the footnotes to Table 19.
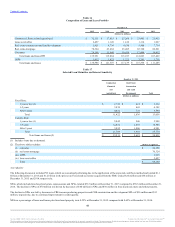
·In addition, BB&T has concluded that the inclusion of PCI in “Loans 90 days or more past due and still accruing as a percentage of total
loans and leases” may result in significant distortion to this ratio. The inclusion of these loans could result in a lack of comparability across
quarters or years, and could negatively impact comparability with other portfolios that were not impacted by acquisition accounting.
BB&T believes that the presentation of this asset quality measure excluding PCI provides additional perspective into underlying trends
related to the quality of its loan portfolio. Accordingly, the asset quality measures in Table 20 present asset quality information on a
consolidated basis as well as “Loans 90 days or more past due and still accruing as a percentage of total loans and leases” excluding PCI.
50
Source: BB&T CORP, 10-K, February 25, 2016 Powered by Morningstar® Document Research℠
The information contained herein may not be copied, adapted or distributed and is not warranted to be accurate, complete or timely. The user assumes all risks for any damages or losses arising from any use of this information,
except to the extent such damages or losses cannot be limited or excluded by applicable law. Past financial performance is no guarantee of future results.