BB&T 2015 Annual Report Download - page 33
Download and view the complete annual report
Please find page 33 of the 2015 BB&T annual report below. You can navigate through the pages in the report by either clicking on the pages listed below, or by using the keyword search tool below to find specific information within the annual report.-
 1
1 -
2
-
3
-
4
-
5
-
6
-
7
-
8
-
9
-
10
-
11
-
12
-
13
-
14
-
15
-
16
-
17
-
18
-
19
-
20
-
21
-
22
-
 23
23 -
 24
24 -
 25
25 -
 26
26 -
 27
27 -
 28
28 -
 29
29 -
 30
30 -
 31
31 -
 32
32 -
 33
33 -
 34
34 -
 35
35 -
 36
36 -
 37
37 -
 38
38 -
 39
39 -
 40
40 -
 41
41 -
 42
42 -
 43
43 -
44
-
45
-
46
-
47
-
48
-
49
-
50
-
51
-
52
-
53
-
54
-
55
-
56
-
57
-
58
-
59
-
60
-
61
-
62
-
63
-
64
-
65
-
66
-
67
-
68
-
69
-
70
-
71
-
72
-
73
-
74
-
75
-
76
-
77
-
78
-
79
-
80
-
81
-
82
-
83
-
84
-
85
-
86
-
87
-
88
-
89
-
90
-
91
-
92
-
93
-
94
-
95
-
96
-
97
-
98
-
99
-
100
-
101
-
102
-
103
-
104
-
105
-
106
-
107
-
108
-
109
-
110
-
111
-
112
-
113
-
114
-
115
-
116
-
117
-
118
-
119
-
120
-
121
-
122
-
123
-
124
-
125
-
126
-
127
-
128
-
129
-
130
-
131
-
132
-
133
-
134
-
135
-
136
-
137
-
138
-
139
-
140
-
141
-
142
-
143
-
144
-
145
-
146
-
147
-
148
-
149
-
150
-
151
-
152
-
153
-
154
-
155
-
156
-
157
-
158
-
159
-
160
-
161
-
162
-
163
-
164
-
165
-
166
-
167
-
168
-
169
-
170
-
171
-
172
-
173
-
174
-
175
-
176
-
177
-
178
-
179
-
180
-
181
-
182
-
183
-
184
-
185
-
186
-
187
-
188
-
189
-
190
-
191
-
192
-
193
-
194
-
195
-
196
-
197
-
198
-
199
-
200
-
201
-
202
-
203
-
204
-
205
-
206
-
207
-
208
-
209
-
210
-
211
-
212
-
213
-
214
-
215
-
216
-
217
-
218
-
219
-
220
-
221
-
222
-
223
-
224
-
225
-
226
-
227
-
228
-
229
-
230
-
231
-
232
-
233
-
234
-
235
-
236
-
237
-
238
-
239
-
240
-
241
-
242
-
243
-
244
-
245
-
246
-
247
-
248
-
249
-
250
-
251
-
252
-
253
-
254
-
255
-
256
-
257
-
258
-
259
-
260
-
261
-
262
-
263
-
264
-
265
-
266
-
267
-
268
-
269
-
270
-
271
-
272
-
273
-
274
-
275
-
276
-
277
-
278
-
279
-
280
-
281
-
282
-
283
-
284
-
285
-
286
-
287
-
288
-
289
-
290
-
291
-
292
-
293
-
294
-
295
-
296
-
297
-
298
-
299
-
300
-
301
-
302
-
303
-
304
-
305
-
306
-
307
-
308
-
309
-
310
-
311
-
312
-
313
-
314
-
315
-
316
-
317
-
318
-
319
-
320
-
321
-
322
-
323
-
324
-
325
-
326
-
327
-
328
-
329
-
330
-
331
-
332
-
333
-
334
-
335
-
336
-
337
-
338
-
339
-
340
-
341
-
342
-
343
-
344
-
345
-
346
-
347
-
348
-
349
-
350
-
351
-
352
-
353
-
354
-
355
-
356
-
357
-
358
-
359
-
360
-
361
-
362
-
363
-
364
-
365
-
366
-
367
-
368
-
369
-
370
 |
 |

TableofContents
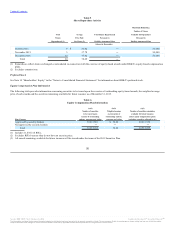
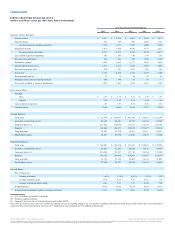
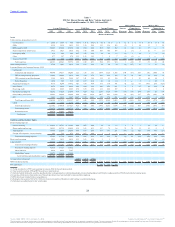
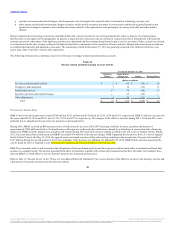
Summary Income Statement:
Interest income $ 6,473 $ 6,286 $ 6,654 $ 7,068 $ 7,035
Interest expense 735 769 892 1,062 1,381
Net interest income-taxable equivalent 5,738 5,517 5,762 6,006 5,654
Noninterest income 4,019 3,856 4,036 3,973 3,217
Revenue-taxable equivalent 9,757 9,373 9,798 9,979 8,871
Less: taxable equivalent adjustment 146 143 146 149 147
Provision for credit losses 428 251 592 1,057 1,190
Noninterest expense 6,266 5,852 5,777 5,828 5,802
Income before income taxes 2,917 3,127 3,283 2,945 1,732
Provision for income taxes 794 921 1,553 892 384
Net income 2,123 2,206 1,730 2,053 1,348
Noncontrolling interest 39 75 50 49 43
Dividends and accretion on preferred stock 148 148 117 63 ―
Net income available to common shareholders 1,936 1,983 1,563 1,941 1,305
Per Common Share:
Earnings:
Basic $ 2.59 $ 2.76 $ 2.22 $ 2.78 $ 1.87
Diluted 2.56 2.72 2.19 2.74 1.85
Cash dividends declared (1) 1.05 0.95 0.92 0.80 0.65
Common equity 31.66 30.09 28.48 27.17 24.90
Average Balances:
Total assets $ 197,347 $ 185,095 $ 181,282 $ 178,592 $ 162,903
Securities, at amortized cost (2) 42,103 40,541 36,772 36,334 29,923
Loans and leases (3) 127,802 118,830 117,527 113,733 105,962
Deposits 138,498 129,077 128,555 127,617 112,318
Long-term debt 23,343 22,210 19,301 20,651 22,257
Shareholders' equity 25,871 23,954 21,860 19,435 17,204
Period-End Balances:
Total assets $ 209,947 $ 186,834 $ 183,043 $ 184,469 $ 174,956
Securities, at amortized cost (2) 43,827 41,147 40,205 38,731 36,407
Loans and leases (3) 136,986 121,307 117,139 118,364 111,205
Deposits 149,124 129,040 127,475 133,075 124,939
Long-term debt 23,769 23,312 21,493 19,114 21,803
Shareholders' equity 27,340 24,377 22,780 21,193 17,425
Selected Ratios:
Rate of return on:
Average total assets 1.08 % 1.19 % 0.95 % 1.15 % 0.83 %
Average common equity 8.34 9.32 8.07 10.52 7.61
Average total shareholders' equity 8.21 9.21 7.91 10.56 7.84
Dividend payout 40.54 34.42 41.44 28.78 34.76
Average total shareholders' equity to average total assets 13.11 12.94 12.06 10.88 10.56
(1) 2011 included a special $0.01 dividend.
(2) Excludes trading securities.
(3) Loans and leases are net of unearned income and include LHFS.
Note: Prior periods have been revised to reflect the adoption of new accounting guidance for investments in qualified affordable housing projects and certain other reclassifications to
conform to the current presentation. See Note 14 "Commitments and Contingencies" for additional information.
Source: BB&T CORP, 10-K, February 25, 2016 Powered by Morningstar® Document Research℠
The information contained herein may not be copied, adapted or distributed and is not warranted to be accurate, complete or timely. The user assumes all risks for any damages or losses arising from any use of this information,
except to the extent such damages or losses cannot be limited or excluded by applicable law. Past financial performance is no guarantee of future results.