BB&T 2015 Annual Report Download - page 89
Download and view the complete annual report
Please find page 89 of the 2015 BB&T annual report below. You can navigate through the pages in the report by either clicking on the pages listed below, or by using the keyword search tool below to find specific information within the annual report.-
 1
1 -
2
-
3
-
4
-
5
-
6
-
7
-
8
-
9
-
10
-
11
-
12
-
13
-
14
-
15
-
16
-
17
-
18
-
19
-
20
-
21
-
22
-
23
-
24
-
25
-
26
-
27
-
28
-
29
-
30
-
31
-
32
-
33
-
34
-
35
-
36
-
37
-
38
-
39
-
40
-
41
-
42
-
43
-
44
-
45
-
46
-
47
-
48
-
49
-
50
-
51
-
52
-
53
-
54
-
55
-
56
-
57
-
58
-
59
-
60
-
61
-
62
-
63
-
64
-
65
-
66
-
67
-
68
-
69
-
70
-
71
-
72
-
73
-
74
-
75
-
76
-
77
-
78
-
 79
79 -
 80
80 -
 81
81 -
 82
82 -
 83
83 -
 84
84 -
 85
85 -
 86
86 -
 87
87 -
 88
88 -
 89
89 -
 90
90 -
 91
91 -
 92
92 -
 93
93 -
 94
94 -
 95
95 -
 96
96 -
 97
97 -
 98
98 -
 99
99 -
100
-
101
-
102
-
103
-
104
-
105
-
106
-
107
-
108
-
109
-
110
-
111
-
112
-
113
-
114
-
115
-
116
-
117
-
118
-
119
-
120
-
121
-
122
-
123
-
124
-
125
-
126
-
127
-
128
-
129
-
130
-
131
-
132
-
133
-
134
-
135
-
136
-
137
-
138
-
139
-
140
-
141
-
142
-
143
-
144
-
145
-
146
-
147
-
148
-
149
-
150
-
151
-
152
-
153
-
154
-
155
-
156
-
157
-
158
-
159
-
160
-
161
-
162
-
163
-
164
-
165
-
166
-
167
-
168
-
169
-
170
-
171
-
172
-
173
-
174
-
175
-
176
-
177
-
178
-
179
-
180
-
181
-
182
-
183
-
184
-
185
-
186
-
187
-
188
-
189
-
190
-
191
-
192
-
193
-
194
-
195
-
196
-
197
-
198
-
199
-
200
-
201
-
202
-
203
-
204
-
205
-
206
-
207
-
208
-
209
-
210
-
211
-
212
-
213
-
214
-
215
-
216
-
217
-
218
-
219
-
220
-
221
-
222
-
223
-
224
-
225
-
226
-
227
-
228
-
229
-
230
-
231
-
232
-
233
-
234
-
235
-
236
-
237
-
238
-
239
-
240
-
241
-
242
-
243
-
244
-
245
-
246
-
247
-
248
-
249
-
250
-
251
-
252
-
253
-
254
-
255
-
256
-
257
-
258
-
259
-
260
-
261
-
262
-
263
-
264
-
265
-
266
-
267
-
268
-
269
-
270
-
271
-
272
-
273
-
274
-
275
-
276
-
277
-
278
-
279
-
280
-
281
-
282
-
283
-
284
-
285
-
286
-
287
-
288
-
289
-
290
-
291
-
292
-
293
-
294
-
295
-
296
-
297
-
298
-
299
-
300
-
301
-
302
-
303
-
304
-
305
-
306
-
307
-
308
-
309
-
310
-
311
-
312
-
313
-
314
-
315
-
316
-
317
-
318
-
319
-
320
-
321
-
322
-
323
-
324
-
325
-
326
-
327
-
328
-
329
-
330
-
331
-
332
-
333
-
334
-
335
-
336
-
337
-
338
-
339
-
340
-
341
-
342
-
343
-
344
-
345
-
346
-
347
-
348
-
349
-
350
-
351
-
352
-
353
-
354
-
355
-
356
-
357
-
358
-
359
-
360
-
361
-
362
-
363
-
364
-
365
-
366
-
367
-
368
-
369
-
370
 |
 |
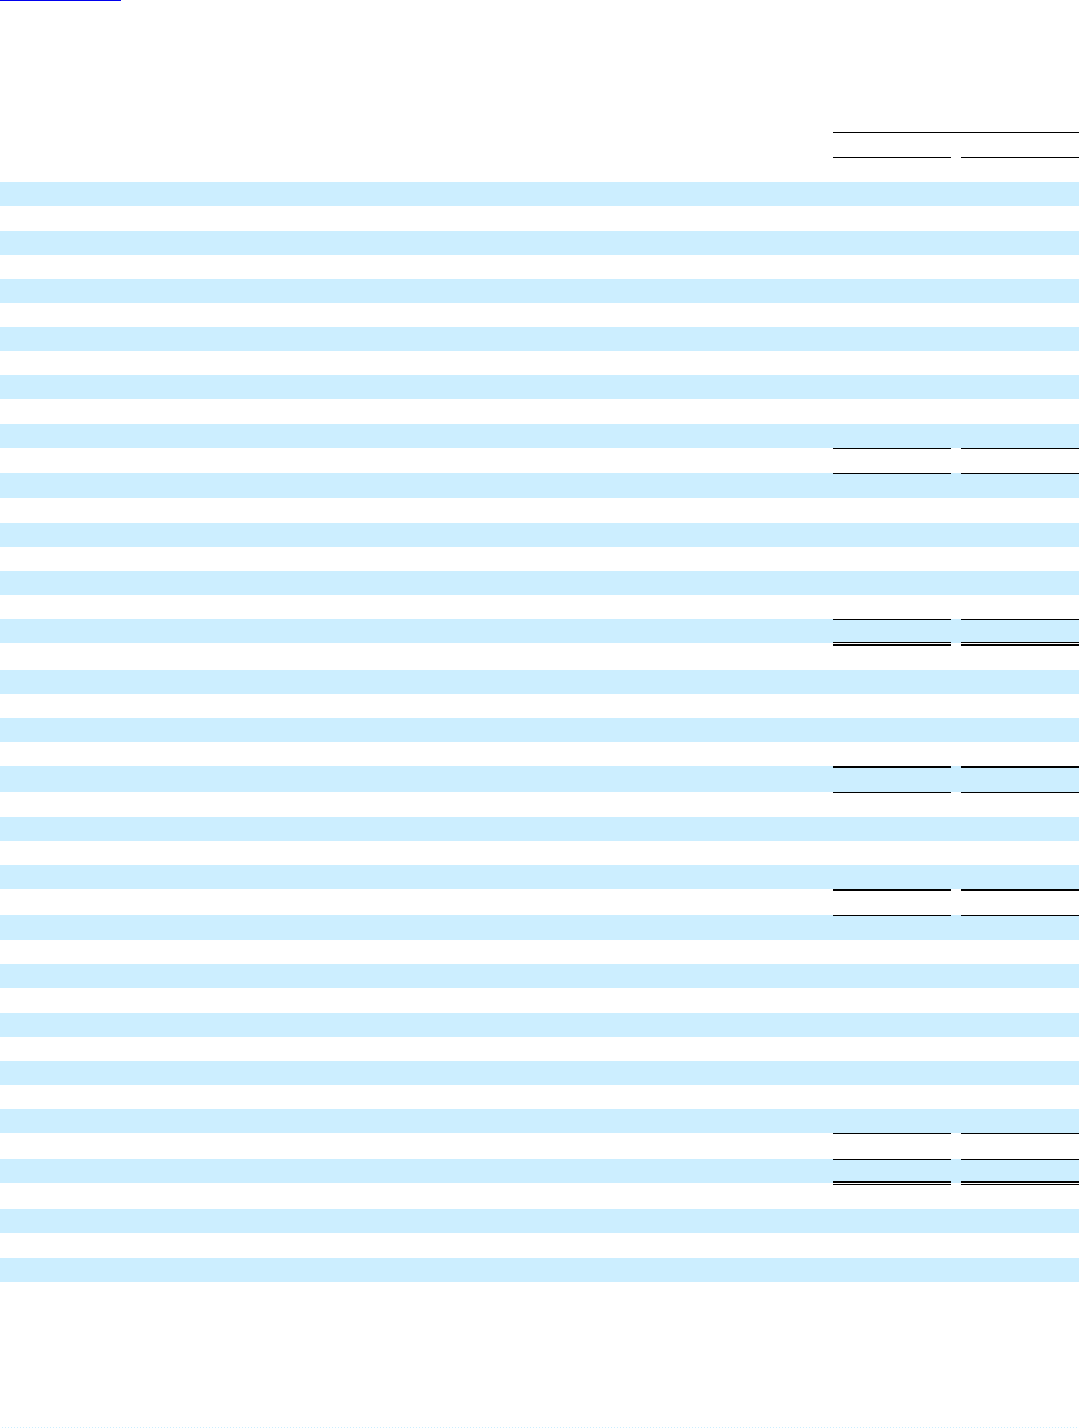
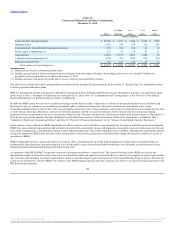
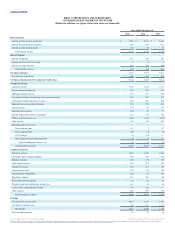
TableofContents
Cash and due from banks $ 2,123 $ 1,639
Interest-bearing deposits with banks 1,435 529
Federal funds sold and securities purchased under resale agreements or similar
arrangements 153 157
Restricted cash 456 374
AFS securities at fair value 25,297 20,907
HTM securities (fair value of $18,519 and $20,313 at December 31, 2015
and December 31, 2014, respectively) 18,530 20,240
LHFS at fair value 1,035 1,423
Loans and leases 135,951 119,884
ALLL (1,460) (1,474)
Loans and leases, net of ALLL 134,491 118,410
Premises and equipment 2,007 1,827
Goodwill 8,548 6,869
CDI and other intangible assets 686 505
Residential MSRs at fair value 880 844
Other assets 14,306 13,110
Total assets $ 209,947 $ 186,834
Deposits:
Noninterest-bearing deposits $ 45,695 $ 38,786
Interest-bearing deposits 103,429 90,254
Total deposits 149,124 129,040
Short-term borrowings 3,593 3,717
Long-term debt 23,769 23,312
Accounts payable and other liabilities 6,121 6,388
Total liabilities 182,607 162,457
Commitments and contingencies (Note 14)
Shareholders’ equity:
Preferred stock, $5 par, liquidation preference of $25,000 per share 2,603 2,603
Common stock, $5 par 3,902 3,603
Additional paid-in capital 8,365 6,517
Retained earnings 13,464 12,317
AOCI, net of deferred income taxes (1,028) (751)
Noncontrolling interests 34 88
Total shareholders’ equity 27,340 24,377
Total liabilities and shareholders’ equity $ 209,947 $ 186,834
Common shares outstanding 780,337 720,698
Common shares authorized 2,000,000 2,000,000
Preferred shares outstanding 107 107
Preferred shares authorized 5,000 5,000
The accompanying notes are an integral part of these consolidated financial statements.
82
Source: BB&T CORP, 10-K, February 25, 2016 Powered by Morningstar® Document Research℠
The information contained herein may not be copied, adapted or distributed and is not warranted to be accurate, complete or timely. The user assumes all risks for any damages or losses arising from any use of this information,
except to the extent such damages or losses cannot be limited or excluded by applicable law. Past financial performance is no guarantee of future results.