BB&T 2015 Annual Report Download - page 149
Download and view the complete annual report
Please find page 149 of the 2015 BB&T annual report below. You can navigate through the pages in the report by either clicking on the pages listed below, or by using the keyword search tool below to find specific information within the annual report.-
 1
1 -
2
-
3
-
4
-
5
-
6
-
7
-
8
-
9
-
10
-
11
-
12
-
13
-
14
-
15
-
16
-
17
-
18
-
19
-
20
-
21
-
22
-
23
-
24
-
25
-
26
-
27
-
28
-
29
-
30
-
31
-
32
-
33
-
34
-
35
-
36
-
37
-
38
-
39
-
40
-
41
-
42
-
43
-
44
-
45
-
46
-
47
-
48
-
49
-
50
-
51
-
52
-
53
-
54
-
55
-
56
-
57
-
58
-
59
-
60
-
61
-
62
-
63
-
64
-
65
-
66
-
67
-
68
-
69
-
70
-
71
-
72
-
73
-
74
-
75
-
76
-
77
-
78
-
79
-
80
-
81
-
82
-
83
-
84
-
85
-
86
-
87
-
88
-
89
-
90
-
91
-
92
-
93
-
94
-
95
-
96
-
97
-
98
-
99
-
100
-
101
-
102
-
103
-
104
-
105
-
106
-
107
-
108
-
109
-
110
-
111
-
112
-
113
-
114
-
115
-
116
-
117
-
118
-
119
-
120
-
121
-
122
-
123
-
124
-
125
-
126
-
127
-
128
-
129
-
130
-
131
-
132
-
133
-
134
-
135
-
136
-
137
-
138
-
 139
139 -
 140
140 -
 141
141 -
 142
142 -
 143
143 -
 144
144 -
 145
145 -
 146
146 -
 147
147 -
 148
148 -
 149
149 -
 150
150 -
 151
151 -
 152
152 -
 153
153 -
 154
154 -
 155
155 -
 156
156 -
 157
157 -
 158
158 -
 159
159 -
160
-
161
-
162
-
163
-
164
-
165
-
166
-
167
-
168
-
169
-
170
-
171
-
172
-
173
-
174
-
175
-
176
-
177
-
178
-
179
-
180
-
181
-
182
-
183
-
184
-
185
-
186
-
187
-
188
-
189
-
190
-
191
-
192
-
193
-
194
-
195
-
196
-
197
-
198
-
199
-
200
-
201
-
202
-
203
-
204
-
205
-
206
-
207
-
208
-
209
-
210
-
211
-
212
-
213
-
214
-
215
-
216
-
217
-
218
-
219
-
220
-
221
-
222
-
223
-
224
-
225
-
226
-
227
-
228
-
229
-
230
-
231
-
232
-
233
-
234
-
235
-
236
-
237
-
238
-
239
-
240
-
241
-
242
-
243
-
244
-
245
-
246
-
247
-
248
-
249
-
250
-
251
-
252
-
253
-
254
-
255
-
256
-
257
-
258
-
259
-
260
-
261
-
262
-
263
-
264
-
265
-
266
-
267
-
268
-
269
-
270
-
271
-
272
-
273
-
274
-
275
-
276
-
277
-
278
-
279
-
280
-
281
-
282
-
283
-
284
-
285
-
286
-
287
-
288
-
289
-
290
-
291
-
292
-
293
-
294
-
295
-
296
-
297
-
298
-
299
-
300
-
301
-
302
-
303
-
304
-
305
-
306
-
307
-
308
-
309
-
310
-
311
-
312
-
313
-
314
-
315
-
316
-
317
-
318
-
319
-
320
-
321
-
322
-
323
-
324
-
325
-
326
-
327
-
328
-
329
-
330
-
331
-
332
-
333
-
334
-
335
-
336
-
337
-
338
-
339
-
340
-
341
-
342
-
343
-
344
-
345
-
346
-
347
-
348
-
349
-
350
-
351
-
352
-
353
-
354
-
355
-
356
-
357
-
358
-
359
-
360
-
361
-
362
-
363
-
364
-
365
-
366
-
367
-
368
-
369
-
370
 |
 |

TableofContents
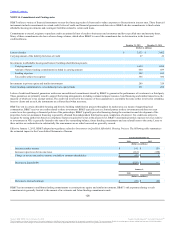
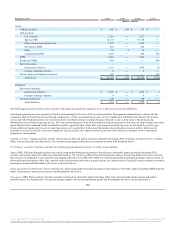
The following table details the fair value and UPB of LHFS that were elected to be carried at fair value:
LHFS reported at fair value $ 1,035 $ 1,023 $ 12 $ 1,423 $ 1,390 $ 33
Excluding government guaranteed, LHFS that were in nonaccrual status or 90 days or more past due and still accruing interest were not material at December
31, 2015.
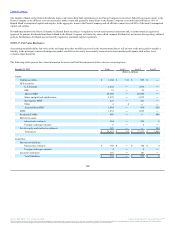
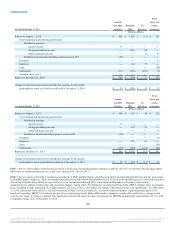
The following table provides information about certain financial assets measured at fair value on a nonrecurring basis, which are primarily collateral
dependent and may be subject to liquidity adjustments. The carrying values represent end of period values, which approximate the fair value measurements
that occurred on the various measurement dates throughout the period. The valuation adjustments represent the amounts recorded during the period
regardless of whether the asset is still held at period end. These assets are considered to be Level 3 assets (excludes PCI).
Impaired loans $ 149 $ (30) $ 109 $ (52)
Foreclosed real estate 82 (190) 87 (176)
Refer to Note 2 “Acquisitions and Divestitures” for fair value measurements related to acquisitions.
For financial instruments not recorded at fair value, estimates of fair value are based on relevant market data and information about the instrument. Values
obtained relate to one trading unit without regard to any premium or discount that may result from concentrations of ownership, possible tax ramifications,
estimated transaction costs that may result from bulk sales or the relationship between various instruments.
An active market does not exist for certain financial instruments. Fair value estimates for these instruments are based on current economic conditions,
currency and interest rate risk characteristics, loss experience and other factors. Many of these estimates involve uncertainties and matters of significant
judgment and cannot be determined with precision. Therefore, the fair value estimates in many instances cannot be substantiated by comparison to
independent markets and, in many cases, may not be realizable in a current sale of the instrument. In addition, changes in assumptions could significantly
affect these fair value estimates. The following assumptions were used to estimate the fair value of these financial instruments.
Cash and cash equivalents and restricted cash: For these short-term instruments, the carrying amounts are a reasonable estimate of fair values.
HTM securities: The fair values of HTM securities are based on a market approach using observable inputs such as benchmark yields and securities, TBA
prices, reported trades, issuer spreads, current bids and offers, monthly payment information and collateral performance.
Loans receivable: The fair values for loans are estimated using discounted cash flow analyses, applying interest rates currently being offered for loans with
similar terms and credit quality, which are deemed to be indicative of orderly transactions in the current market. For commercial loans and leases, discount
rates may be adjusted to address additional credit risk on lower risk grade instruments. For residential mortgage and other consumer loans, internal
prepayment risk models are used to adjust contractual cash flows. Loans are aggregated into pools of similar terms and credit quality and discounted using a
LIBOR based rate. The carrying amounts of accrued interest approximate fair values.
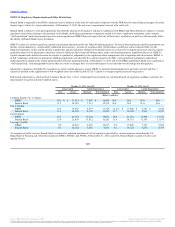
FDIC loss share receivable and payable: The fair values of the receivable and payable are estimated using discounted cash flow analyses, applying a risk free
interest rate that is adjusted for the uncertainty in the timing and amount of the cash flows. The expected cash flows to/from the FDIC related to loans were
estimated using the same assumptions that were used in determining the accounting values for the related loans. The expected cash flows to/from the FDIC
related to securities are based upon the fair value of the related securities and the payment that would be required if the securities were sold for that amount.
The loss share agreements are not transferrable and, accordingly, there is no market for the receivable or payable.
136
Source: BB&T CORP, 10-K, February 25, 2016 Powered by Morningstar® Document Research℠
The information contained herein may not be copied, adapted or distributed and is not warranted to be accurate, complete or timely. The user assumes all risks for any damages or losses arising from any use of this information,
except to the extent such damages or losses cannot be limited or excluded by applicable law. Past financial performance is no guarantee of future results.