BB&T 2015 Annual Report Download - page 50
Download and view the complete annual report
Please find page 50 of the 2015 BB&T annual report below. You can navigate through the pages in the report by either clicking on the pages listed below, or by using the keyword search tool below to find specific information within the annual report.-
 1
1 -
2
-
3
-
4
-
5
-
6
-
7
-
8
-
9
-
10
-
11
-
12
-
13
-
14
-
15
-
16
-
17
-
18
-
19
-
20
-
21
-
22
-
23
-
24
-
25
-
26
-
27
-
28
-
29
-
30
-
31
-
32
-
33
-
34
-
35
-
36
-
37
-
38
-
39
-
 40
40 -
 41
41 -
 42
42 -
 43
43 -
 44
44 -
 45
45 -
 46
46 -
 47
47 -
 48
48 -
 49
49 -
 50
50 -
 51
51 -
 52
52 -
 53
53 -
 54
54 -
 55
55 -
 56
56 -
 57
57 -
 58
58 -
 59
59 -
 60
60 -
61
-
62
-
63
-
64
-
65
-
66
-
67
-
68
-
69
-
70
-
71
-
72
-
73
-
74
-
75
-
76
-
77
-
78
-
79
-
80
-
81
-
82
-
83
-
84
-
85
-
86
-
87
-
88
-
89
-
90
-
91
-
92
-
93
-
94
-
95
-
96
-
97
-
98
-
99
-
100
-
101
-
102
-
103
-
104
-
105
-
106
-
107
-
108
-
109
-
110
-
111
-
112
-
113
-
114
-
115
-
116
-
117
-
118
-
119
-
120
-
121
-
122
-
123
-
124
-
125
-
126
-
127
-
128
-
129
-
130
-
131
-
132
-
133
-
134
-
135
-
136
-
137
-
138
-
139
-
140
-
141
-
142
-
143
-
144
-
145
-
146
-
147
-
148
-
149
-
150
-
151
-
152
-
153
-
154
-
155
-
156
-
157
-
158
-
159
-
160
-
161
-
162
-
163
-
164
-
165
-
166
-
167
-
168
-
169
-
170
-
171
-
172
-
173
-
174
-
175
-
176
-
177
-
178
-
179
-
180
-
181
-
182
-
183
-
184
-
185
-
186
-
187
-
188
-
189
-
190
-
191
-
192
-
193
-
194
-
195
-
196
-
197
-
198
-
199
-
200
-
201
-
202
-
203
-
204
-
205
-
206
-
207
-
208
-
209
-
210
-
211
-
212
-
213
-
214
-
215
-
216
-
217
-
218
-
219
-
220
-
221
-
222
-
223
-
224
-
225
-
226
-
227
-
228
-
229
-
230
-
231
-
232
-
233
-
234
-
235
-
236
-
237
-
238
-
239
-
240
-
241
-
242
-
243
-
244
-
245
-
246
-
247
-
248
-
249
-
250
-
251
-
252
-
253
-
254
-
255
-
256
-
257
-
258
-
259
-
260
-
261
-
262
-
263
-
264
-
265
-
266
-
267
-
268
-
269
-
270
-
271
-
272
-
273
-
274
-
275
-
276
-
277
-
278
-
279
-
280
-
281
-
282
-
283
-
284
-
285
-
286
-
287
-
288
-
289
-
290
-
291
-
292
-
293
-
294
-
295
-
296
-
297
-
298
-
299
-
300
-
301
-
302
-
303
-
304
-
305
-
306
-
307
-
308
-
309
-
310
-
311
-
312
-
313
-
314
-
315
-
316
-
317
-
318
-
319
-
320
-
321
-
322
-
323
-
324
-
325
-
326
-
327
-
328
-
329
-
330
-
331
-
332
-
333
-
334
-
335
-
336
-
337
-
338
-
339
-
340
-
341
-
342
-
343
-
344
-
345
-
346
-
347
-
348
-
349
-
350
-
351
-
352
-
353
-
354
-
355
-
356
-
357
-
358
-
359
-
360
-
361
-
362
-
363
-
364
-
365
-
366
-
367
-
368
-
369
-
370
 |
 |

TableofContents
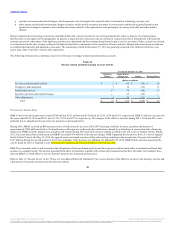
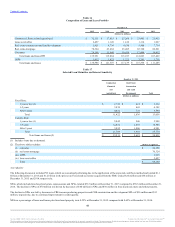
The following table presents the securities portfolio at December 31, 2015, segregated by major category with ranges of maturities and average yields
disclosed:
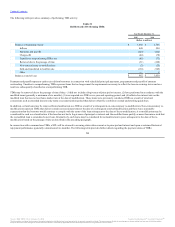
U.S. Treasury:
Within one year $ 246 0.49 % $ ― ― %
One to five years 1,392 1.29 1,097 2.21
Five to ten years 194 2.02 ― ―
Total 1,832 1.26 1,097 2.21
GSE:
One to five years ― ― 1,000 1.56
Five to ten years 51 2.14 4,045 2.21
Total 51 2.14 5,045 2.08
Agency MBS: (2)
One to five years 10 3.82 ― ―
Five to ten years 18 2.34 ― ―
After ten years 20,018 1.81 12,267 2.11
Total 20,046 1.81 12,267 2.11
States and political subdivisions: (3)
Within one year 12 6.93 ― ―
One to five years 79 6.27 ― ―
Five to ten years 620 5.65 17 1.33
After ten years 1,368 6.30 46 0.98
Total 2,079 6.11 63 1.07
Non-agency MBS: (2)
After ten years 221 7.96 ― ―
Total 221 7.96 ― ―
Other:
Within one year 4 0.48 1 1.29
After ten years ― ― 57 1.69
Total 4 0.48 58 1.69
Acquired from FDIC:
Within one year 2 4.51 ― ―
One to five years 186 3.70 ― ―
Five to ten years 108 4.00 ― ―
After ten years 768 17.72 ― ―
Total 1,064 13.86 ― ―
Total securities $ 25,297 2.68 $ 18,530 2.10
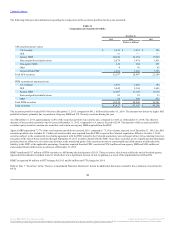
(1) Yields represent interest computed at the end of the period using the effective interest method on an FTE basis applying the statutory federal income tax
rate of 35% and the amortized cost of the securities.
(2) For purposes of the maturity table, MBS, which are not due at a single maturity date, have been included in maturity groupings based on the contractual
maturity. The expected life of MBS will differ from contractual maturities because borrowers may have the right to call or prepay the underlying
mortgage loans.
(3) Weighted-average yield excludes the effect of pay-fixed swaps hedging municipal securities.
Source: BB&T CORP, 10-K, February 25, 2016 Powered by Morningstar® Document Research℠
The information contained herein may not be copied, adapted or distributed and is not warranted to be accurate, complete or timely. The user assumes all risks for any damages or losses arising from any use of this information,
except to the extent such damages or losses cannot be limited or excluded by applicable law. Past financial performance is no guarantee of future results.