BB&T 2015 Annual Report Download - page 35
Download and view the complete annual report
Please find page 35 of the 2015 BB&T annual report below. You can navigate through the pages in the report by either clicking on the pages listed below, or by using the keyword search tool below to find specific information within the annual report.-
 1
1 -
2
-
3
-
4
-
5
-
6
-
7
-
8
-
9
-
10
-
11
-
12
-
13
-
14
-
15
-
16
-
17
-
18
-
19
-
20
-
21
-
22
-
23
-
24
-
 25
25 -
 26
26 -
 27
27 -
 28
28 -
 29
29 -
 30
30 -
 31
31 -
 32
32 -
 33
33 -
 34
34 -
 35
35 -
 36
36 -
 37
37 -
 38
38 -
 39
39 -
 40
40 -
 41
41 -
 42
42 -
 43
43 -
 44
44 -
 45
45 -
46
-
47
-
48
-
49
-
50
-
51
-
52
-
53
-
54
-
55
-
56
-
57
-
58
-
59
-
60
-
61
-
62
-
63
-
64
-
65
-
66
-
67
-
68
-
69
-
70
-
71
-
72
-
73
-
74
-
75
-
76
-
77
-
78
-
79
-
80
-
81
-
82
-
83
-
84
-
85
-
86
-
87
-
88
-
89
-
90
-
91
-
92
-
93
-
94
-
95
-
96
-
97
-
98
-
99
-
100
-
101
-
102
-
103
-
104
-
105
-
106
-
107
-
108
-
109
-
110
-
111
-
112
-
113
-
114
-
115
-
116
-
117
-
118
-
119
-
120
-
121
-
122
-
123
-
124
-
125
-
126
-
127
-
128
-
129
-
130
-
131
-
132
-
133
-
134
-
135
-
136
-
137
-
138
-
139
-
140
-
141
-
142
-
143
-
144
-
145
-
146
-
147
-
148
-
149
-
150
-
151
-
152
-
153
-
154
-
155
-
156
-
157
-
158
-
159
-
160
-
161
-
162
-
163
-
164
-
165
-
166
-
167
-
168
-
169
-
170
-
171
-
172
-
173
-
174
-
175
-
176
-
177
-
178
-
179
-
180
-
181
-
182
-
183
-
184
-
185
-
186
-
187
-
188
-
189
-
190
-
191
-
192
-
193
-
194
-
195
-
196
-
197
-
198
-
199
-
200
-
201
-
202
-
203
-
204
-
205
-
206
-
207
-
208
-
209
-
210
-
211
-
212
-
213
-
214
-
215
-
216
-
217
-
218
-
219
-
220
-
221
-
222
-
223
-
224
-
225
-
226
-
227
-
228
-
229
-
230
-
231
-
232
-
233
-
234
-
235
-
236
-
237
-
238
-
239
-
240
-
241
-
242
-
243
-
244
-
245
-
246
-
247
-
248
-
249
-
250
-
251
-
252
-
253
-
254
-
255
-
256
-
257
-
258
-
259
-
260
-
261
-
262
-
263
-
264
-
265
-
266
-
267
-
268
-
269
-
270
-
271
-
272
-
273
-
274
-
275
-
276
-
277
-
278
-
279
-
280
-
281
-
282
-
283
-
284
-
285
-
286
-
287
-
288
-
289
-
290
-
291
-
292
-
293
-
294
-
295
-
296
-
297
-
298
-
299
-
300
-
301
-
302
-
303
-
304
-
305
-
306
-
307
-
308
-
309
-
310
-
311
-
312
-
313
-
314
-
315
-
316
-
317
-
318
-
319
-
320
-
321
-
322
-
323
-
324
-
325
-
326
-
327
-
328
-
329
-
330
-
331
-
332
-
333
-
334
-
335
-
336
-
337
-
338
-
339
-
340
-
341
-
342
-
343
-
344
-
345
-
346
-
347
-
348
-
349
-
350
-
351
-
352
-
353
-
354
-
355
-
356
-
357
-
358
-
359
-
360
-
361
-
362
-
363
-
364
-
365
-
366
-
367
-
368
-
369
-
370
 |
 |

TableofContents
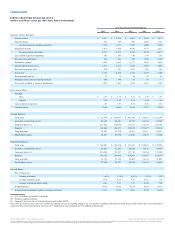
Executive Overview
Overview of Significant Events and Financial Results
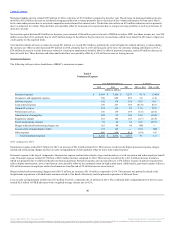
Net income available to common shareholders totaled $1.9 billion for 2015, a 2.4% decline from the prior year. On a diluted per common share basis,
earnings for 2015 were $2.56, compared to $2.72 for 2014. BB&T’s results of operations for 2015 produced a return on average assets of 1.08% and a return
on average common shareholders’ equity of 8.34% compared to prior year ratios of 1.19% and 9.32%, respectively. These results include merger-related and
restructuring charges of $165 million for 2015, which reflects current year acquisition activity, compared to $46 million for 2014. Net interest income and
noninterest income were both higher following the current year acquisition activity. Noninterest expense was higher due to increases in headcount and
locations, primarily the result of the acquisitions, and the provision for credit losses increased after an allowance release in the prior year.
Effective January 1, 2015, BB&T adopted new guidance related to the accounting for investments in qualified affordable housing projects. For periods prior
to January 1, 2015, amortization expense related to qualifying investments in low income housing tax credits was reclassified from other income to provision
for income taxes, and the amount of amortization and tax benefits recognized was revised as a result of the adoption of the proportional amortization method.
See Note 14 “Commitments and Contingencies” for additional information.
During 2015, BB&T acquired Susquehanna Bancshares, Inc., which provided $18.3 billion in assets, $14.1 billion in deposits and 245 branches in
Pennsylvania, New Jersey, West Virginia and Maryland. BB&T also acquired The Bank of Kentucky Financial Corporation, which provided $2.0 billion in
assets, $1.6 billion in deposits and 32 branches in the northern Kentucky/Cincinnati market, and completed the purchase of 41 retail branches in Texas,
providing $1.9 billion in deposits. Additionally, BB&T reached an agreement to acquire National Penn Bancshares, Inc., which had $9.6 billion in assets,
$6.7 billion in deposits and 124 branches in Pennsylvania, New Jersey and Maryland as of December 31, 2015.
Industry-wide sustained low interest rates represented a significant challenge for the Company during 2015 and for the past several years. From a NIM
perspective, the negative impact associated with lower yields on loans and securities was partially mitigated by a decrease in funding costs from 0.65% to
0.60%, primarily driven by a decline in the cost of interest-bearing deposits and the early extinguishment of certain higher-cost FHLB advances during 2015
and 2014.
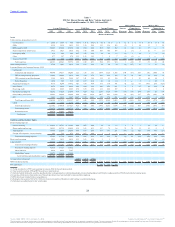
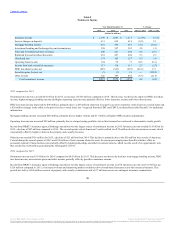
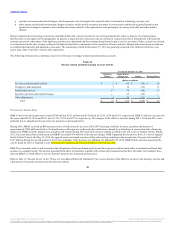
BB&T’s revenues for 2015 were $9.8 billion on a FTE basis, an increase of $384 million compared to 2014. Net interest income on a FTE basis was $221
million higher than the prior year, which reflects a $187 million increase in interest income and a $34 million decrease in interest expense. Noninterest
income increased $163 million for the year, driven by improvements in FDIC loss share income and higher mortgage banking income.
The provision for credit losses was $428 million, compared to $251 million for the prior year. This increase reflects the stabilization in the rate of credit
improvement and prior year loan sales that generated gains through the release of the related ALLL.
Asset quality improved significantly during 2015 as NPAs declined $70 million, or 9.0%, compared to 2014. This decline included a $40 million decrease in
NPLs primarily due to continuing strong asset quality within commercial lending, and a $30 million decrease in foreclosed real estate and other property. Net
charge-offs for 2015 were $436 million, compared to $538 million for the prior year. The ratio of the ALLL to net charge-offs was 3.36x for 2015, compared
to 2.74x in 2014.
Noninterest expense increased $414 million primarily due to higher personnel expense and merger-related and restructuring charges, both of which were
primarily the result of acquisition activity. These increases were partially offset by lower loan-related and other expense as the prior year included $118
million of charges related to the FHA-insured loan origination process.
During 2015, the U.S. Court of Appeals overturned a portion of an earlier ruling related to tax benefits previously disallowed in connection with a financing
transaction that resulted in the recognition of income tax benefits of $107 million.
30
Source: BB&T CORP, 10-K, February 25, 2016 Powered by Morningstar® Document Research℠
The information contained herein may not be copied, adapted or distributed and is not warranted to be accurate, complete or timely. The user assumes all risks for any damages or losses arising from any use of this information,
except to the extent such damages or losses cannot be limited or excluded by applicable law. Past financial performance is no guarantee of future results.