BB&T 2015 Annual Report Download - page 136
Download and view the complete annual report
Please find page 136 of the 2015 BB&T annual report below. You can navigate through the pages in the report by either clicking on the pages listed below, or by using the keyword search tool below to find specific information within the annual report.-
 1
1 -
2
-
3
-
4
-
5
-
6
-
7
-
8
-
9
-
10
-
11
-
12
-
13
-
14
-
15
-
16
-
17
-
18
-
19
-
20
-
21
-
22
-
23
-
24
-
25
-
26
-
27
-
28
-
29
-
30
-
31
-
32
-
33
-
34
-
35
-
36
-
37
-
38
-
39
-
40
-
41
-
42
-
43
-
44
-
45
-
46
-
47
-
48
-
49
-
50
-
51
-
52
-
53
-
54
-
55
-
56
-
57
-
58
-
59
-
60
-
61
-
62
-
63
-
64
-
65
-
66
-
67
-
68
-
69
-
70
-
71
-
72
-
73
-
74
-
75
-
76
-
77
-
78
-
79
-
80
-
81
-
82
-
83
-
84
-
85
-
86
-
87
-
88
-
89
-
90
-
91
-
92
-
93
-
94
-
95
-
96
-
97
-
98
-
99
-
100
-
101
-
102
-
103
-
104
-
105
-
106
-
107
-
108
-
109
-
110
-
111
-
112
-
113
-
114
-
115
-
116
-
117
-
118
-
119
-
120
-
121
-
122
-
123
-
124
-
125
-
 126
126 -
 127
127 -
 128
128 -
 129
129 -
 130
130 -
 131
131 -
 132
132 -
 133
133 -
 134
134 -
 135
135 -
 136
136 -
 137
137 -
 138
138 -
 139
139 -
 140
140 -
 141
141 -
 142
142 -
 143
143 -
 144
144 -
 145
145 -
 146
146 -
147
-
148
-
149
-
150
-
151
-
152
-
153
-
154
-
155
-
156
-
157
-
158
-
159
-
160
-
161
-
162
-
163
-
164
-
165
-
166
-
167
-
168
-
169
-
170
-
171
-
172
-
173
-
174
-
175
-
176
-
177
-
178
-
179
-
180
-
181
-
182
-
183
-
184
-
185
-
186
-
187
-
188
-
189
-
190
-
191
-
192
-
193
-
194
-
195
-
196
-
197
-
198
-
199
-
200
-
201
-
202
-
203
-
204
-
205
-
206
-
207
-
208
-
209
-
210
-
211
-
212
-
213
-
214
-
215
-
216
-
217
-
218
-
219
-
220
-
221
-
222
-
223
-
224
-
225
-
226
-
227
-
228
-
229
-
230
-
231
-
232
-
233
-
234
-
235
-
236
-
237
-
238
-
239
-
240
-
241
-
242
-
243
-
244
-
245
-
246
-
247
-
248
-
249
-
250
-
251
-
252
-
253
-
254
-
255
-
256
-
257
-
258
-
259
-
260
-
261
-
262
-
263
-
264
-
265
-
266
-
267
-
268
-
269
-
270
-
271
-
272
-
273
-
274
-
275
-
276
-
277
-
278
-
279
-
280
-
281
-
282
-
283
-
284
-
285
-
286
-
287
-
288
-
289
-
290
-
291
-
292
-
293
-
294
-
295
-
296
-
297
-
298
-
299
-
300
-
301
-
302
-
303
-
304
-
305
-
306
-
307
-
308
-
309
-
310
-
311
-
312
-
313
-
314
-
315
-
316
-
317
-
318
-
319
-
320
-
321
-
322
-
323
-
324
-
325
-
326
-
327
-
328
-
329
-
330
-
331
-
332
-
333
-
334
-
335
-
336
-
337
-
338
-
339
-
340
-
341
-
342
-
343
-
344
-
345
-
346
-
347
-
348
-
349
-
350
-
351
-
352
-
353
-
354
-
355
-
356
-
357
-
358
-
359
-
360
-
361
-
362
-
363
-
364
-
365
-
366
-
367
-
368
-
369
-
370
 |
 |

TableofContents
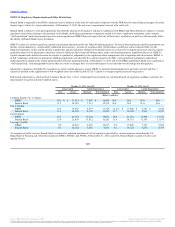
The weighted average expected long-term rate of return on plan assets represents the average rate of return expected to be earned on plan assets over the
period the benefits included in the benefit obligation are to be paid. In developing the expected rate of return, BB&T considers long-term compound
annualized returns of historical market data for each asset category, as well as historical actual returns on the plan assets. Using this reference information, the
Company develops forward-looking return expectations for each asset category and a weighted average expected long-term rate of return for the plan based
on target asset allocations contained in BB&T's Investment Policy Statement. For 2016, the expected rate of return on plan assets is 7.0%.
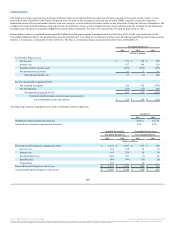
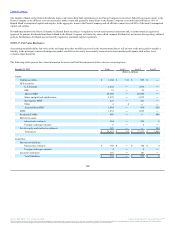
Financial data relative to qualified and nonqualified defined benefit pension plans is summarized in the following tables for the years indicated. On the
Consolidated Balance Sheets, the qualified pension plan prepaid asset is recorded as a component of other assets and the nonqualified pension plans accrued
liability is recorded as a component of other liabilities. The data is calculated using an actuarial measurement date of December 31.
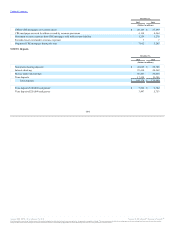
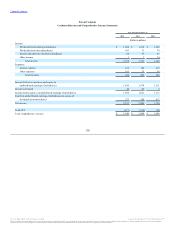
Net Periodic Pension Cost:
Service cost $ 176 $ 138 $ 150
Interest cost 157 140 120
Estimated return on plan assets (327) (296) (257)
Net amortization and other 67 17 91
Net periodic benefit cost 73 (1) 104
Pre-Tax Amounts Recognized in OCI:
Net actuarial loss (gain) 230 532 (535)
Net amortization (67) (17) (91)
Net amount recognized in OCI 163 515 (626)
Total net periodic pension costs (income) recognized in
total comprehensive income, pre-tax $ 236 $ 514 $ (522)
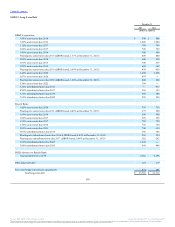
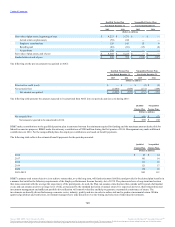
The following actuarial assumptions were used to determine benefit obligations:
Weighted average assumed discount rate 4.68 % 4.27 %
Assumed rate of annual compensation increases 4.50 4.50
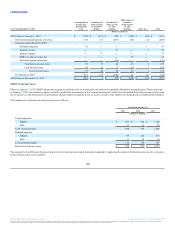
Projected benefit obligation, beginning of year $ 3,227 $ 2,437 $ 367 $ 304
Service cost 164 128 12 10
Interest cost 141 124 16 16
Actuarial (gain) loss (164) 607 (3) 45
Benefits paid (80) (69) (15) (8)
Acquisitions 185 ― 15 ―
Projected benefit obligation, end of year $ 3,473 $ 3,227 $ 392 $ 367
Accumulated benefit obligation, end of year $ 2,997 $ 2,744 $ 309 $ 295
123
Source: BB&T CORP, 10-K, February 25, 2016 Powered by Morningstar® Document Research℠
The information contained herein may not be copied, adapted or distributed and is not warranted to be accurate, complete or timely. The user assumes all risks for any damages or losses arising from any use of this information,
except to the extent such damages or losses cannot be limited or excluded by applicable law. Past financial performance is no guarantee of future results.