BB&T 2015 Annual Report Download - page 118
Download and view the complete annual report
Please find page 118 of the 2015 BB&T annual report below. You can navigate through the pages in the report by either clicking on the pages listed below, or by using the keyword search tool below to find specific information within the annual report.-
 1
1 -
2
-
3
-
4
-
5
-
6
-
7
-
8
-
9
-
10
-
11
-
12
-
13
-
14
-
15
-
16
-
17
-
18
-
19
-
20
-
21
-
22
-
23
-
24
-
25
-
26
-
27
-
28
-
29
-
30
-
31
-
32
-
33
-
34
-
35
-
36
-
37
-
38
-
39
-
40
-
41
-
42
-
43
-
44
-
45
-
46
-
47
-
48
-
49
-
50
-
51
-
52
-
53
-
54
-
55
-
56
-
57
-
58
-
59
-
60
-
61
-
62
-
63
-
64
-
65
-
66
-
67
-
68
-
69
-
70
-
71
-
72
-
73
-
74
-
75
-
76
-
77
-
78
-
79
-
80
-
81
-
82
-
83
-
84
-
85
-
86
-
87
-
88
-
89
-
90
-
91
-
92
-
93
-
94
-
95
-
96
-
97
-
98
-
99
-
100
-
101
-
102
-
103
-
104
-
105
-
106
-
107
-
 108
108 -
 109
109 -
 110
110 -
 111
111 -
 112
112 -
 113
113 -
 114
114 -
 115
115 -
 116
116 -
 117
117 -
 118
118 -
 119
119 -
 120
120 -
 121
121 -
 122
122 -
 123
123 -
 124
124 -
 125
125 -
 126
126 -
 127
127 -
 128
128 -
129
-
130
-
131
-
132
-
133
-
134
-
135
-
136
-
137
-
138
-
139
-
140
-
141
-
142
-
143
-
144
-
145
-
146
-
147
-
148
-
149
-
150
-
151
-
152
-
153
-
154
-
155
-
156
-
157
-
158
-
159
-
160
-
161
-
162
-
163
-
164
-
165
-
166
-
167
-
168
-
169
-
170
-
171
-
172
-
173
-
174
-
175
-
176
-
177
-
178
-
179
-
180
-
181
-
182
-
183
-
184
-
185
-
186
-
187
-
188
-
189
-
190
-
191
-
192
-
193
-
194
-
195
-
196
-
197
-
198
-
199
-
200
-
201
-
202
-
203
-
204
-
205
-
206
-
207
-
208
-
209
-
210
-
211
-
212
-
213
-
214
-
215
-
216
-
217
-
218
-
219
-
220
-
221
-
222
-
223
-
224
-
225
-
226
-
227
-
228
-
229
-
230
-
231
-
232
-
233
-
234
-
235
-
236
-
237
-
238
-
239
-
240
-
241
-
242
-
243
-
244
-
245
-
246
-
247
-
248
-
249
-
250
-
251
-
252
-
253
-
254
-
255
-
256
-
257
-
258
-
259
-
260
-
261
-
262
-
263
-
264
-
265
-
266
-
267
-
268
-
269
-
270
-
271
-
272
-
273
-
274
-
275
-
276
-
277
-
278
-
279
-
280
-
281
-
282
-
283
-
284
-
285
-
286
-
287
-
288
-
289
-
290
-
291
-
292
-
293
-
294
-
295
-
296
-
297
-
298
-
299
-
300
-
301
-
302
-
303
-
304
-
305
-
306
-
307
-
308
-
309
-
310
-
311
-
312
-
313
-
314
-
315
-
316
-
317
-
318
-
319
-
320
-
321
-
322
-
323
-
324
-
325
-
326
-
327
-
328
-
329
-
330
-
331
-
332
-
333
-
334
-
335
-
336
-
337
-
338
-
339
-
340
-
341
-
342
-
343
-
344
-
345
-
346
-
347
-
348
-
349
-
350
-
351
-
352
-
353
-
354
-
355
-
356
-
357
-
358
-
359
-
360
-
361
-
362
-
363
-
364
-
365
-
366
-
367
-
368
-
369
-
370
 |
 |
TableofContents
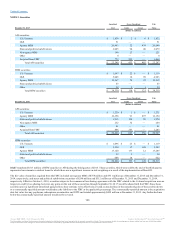
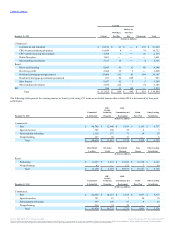
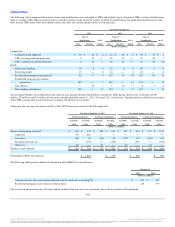
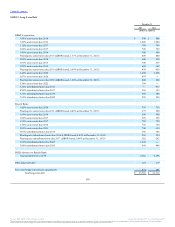
Retail:
Performing $ 8,098 $ 2,460 $ 30,924 $ 9,504 $ 6,052
Nonperforming 48 ― 166 5 54
Total $ 8,146 $ 2,460 $ 31,090 $ 9,509 $ 6,106
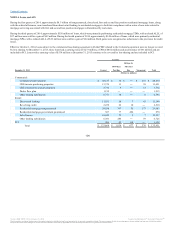
Commercial:
Commercial and industrial $ 421 $ (81) $ 37 $ 89 $ ― $ 466
CRE - income producing properties 162 (20) 7 (14) ― 135
CRE - construction and development 48 (4) 11 (18) ― 37
Dealer floor plan 10 ― ― (2) ― 8
Other lending subsidiaries 21 (9) 3 7 ― 22
Retail:
Direct retail lending 110 (54) 29 20 ― 105
Revolving credit 110 (70) 20 44 ― 104
Residential mortgage-nonguaranteed 217 (40) 3 14 ― 194
Residential mortgage-government guaranteed 36 (6) ― (7) ― 23
Sales finance 40 (26) 9 17 ― 40
Other lending subsidiaries 235 (277) 33 274 ― 265
PCI 64 (1) ― (2) ― 61
ALLL 1,474 (588) 152 422 ― 1,460
RUFC 60 ― ― 6 24 90
ACL $ 1,534 $ (588) $ 152 $ 428 $ 24 $ 1,550
Commercial:
Commercial and industrial $ 454 $ (131) $ 42 $ 56 $ ― $ 421
CRE - income producing properties 149 (31) 14 30 ― 162
CRE - construction and development 76 (11) 19 (36) ― 48
Dealer floor plan 8 ― ― 2 ― 10
Other lending subsidiaries 15 (10) 3 11 ― 21
Retail:
Direct retail lending 209 (69) 29 26 (85) 110
Revolving credit 115 (71) 19 47 ― 110
Residential mortgage-nonguaranteed 269 (82) 7 (62) 85 217
Residential mortgage-government guaranteed 62 (2) ― (24) ― 36
Sales finance 37 (23) 9 17 ― 40
Other lending subsidiaries 224 (259) 30 242 ― 235
PCI 114 (21) ― (29) ― 64
ALLL 1,732 (710) 172 280 ― 1,474
RUFC 89 ― ― (29) ― 60
ACL $ 1,821 $ (710) $ 172 $ 251 $ ― $ 1,534
106
Source: BB&T CORP, 10-K, February 25, 2016 Powered by Morningstar® Document Research℠
The information contained herein may not be copied, adapted or distributed and is not warranted to be accurate, complete or timely. The user assumes all risks for any damages or losses arising from any use of this information,
except to the extent such damages or losses cannot be limited or excluded by applicable law. Past financial performance is no guarantee of future results.