BB&T 2015 Annual Report Download - page 44
Download and view the complete annual report
Please find page 44 of the 2015 BB&T annual report below. You can navigate through the pages in the report by either clicking on the pages listed below, or by using the keyword search tool below to find specific information within the annual report.-
 1
1 -
2
-
3
-
4
-
5
-
6
-
7
-
8
-
9
-
10
-
11
-
12
-
13
-
14
-
15
-
16
-
17
-
18
-
19
-
20
-
21
-
22
-
23
-
24
-
25
-
26
-
27
-
28
-
29
-
30
-
31
-
32
-
33
-
 34
34 -
 35
35 -
 36
36 -
 37
37 -
 38
38 -
 39
39 -
 40
40 -
 41
41 -
 42
42 -
 43
43 -
 44
44 -
 45
45 -
 46
46 -
 47
47 -
 48
48 -
 49
49 -
 50
50 -
 51
51 -
 52
52 -
 53
53 -
 54
54 -
55
-
56
-
57
-
58
-
59
-
60
-
61
-
62
-
63
-
64
-
65
-
66
-
67
-
68
-
69
-
70
-
71
-
72
-
73
-
74
-
75
-
76
-
77
-
78
-
79
-
80
-
81
-
82
-
83
-
84
-
85
-
86
-
87
-
88
-
89
-
90
-
91
-
92
-
93
-
94
-
95
-
96
-
97
-
98
-
99
-
100
-
101
-
102
-
103
-
104
-
105
-
106
-
107
-
108
-
109
-
110
-
111
-
112
-
113
-
114
-
115
-
116
-
117
-
118
-
119
-
120
-
121
-
122
-
123
-
124
-
125
-
126
-
127
-
128
-
129
-
130
-
131
-
132
-
133
-
134
-
135
-
136
-
137
-
138
-
139
-
140
-
141
-
142
-
143
-
144
-
145
-
146
-
147
-
148
-
149
-
150
-
151
-
152
-
153
-
154
-
155
-
156
-
157
-
158
-
159
-
160
-
161
-
162
-
163
-
164
-
165
-
166
-
167
-
168
-
169
-
170
-
171
-
172
-
173
-
174
-
175
-
176
-
177
-
178
-
179
-
180
-
181
-
182
-
183
-
184
-
185
-
186
-
187
-
188
-
189
-
190
-
191
-
192
-
193
-
194
-
195
-
196
-
197
-
198
-
199
-
200
-
201
-
202
-
203
-
204
-
205
-
206
-
207
-
208
-
209
-
210
-
211
-
212
-
213
-
214
-
215
-
216
-
217
-
218
-
219
-
220
-
221
-
222
-
223
-
224
-
225
-
226
-
227
-
228
-
229
-
230
-
231
-
232
-
233
-
234
-
235
-
236
-
237
-
238
-
239
-
240
-
241
-
242
-
243
-
244
-
245
-
246
-
247
-
248
-
249
-
250
-
251
-
252
-
253
-
254
-
255
-
256
-
257
-
258
-
259
-
260
-
261
-
262
-
263
-
264
-
265
-
266
-
267
-
268
-
269
-
270
-
271
-
272
-
273
-
274
-
275
-
276
-
277
-
278
-
279
-
280
-
281
-
282
-
283
-
284
-
285
-
286
-
287
-
288
-
289
-
290
-
291
-
292
-
293
-
294
-
295
-
296
-
297
-
298
-
299
-
300
-
301
-
302
-
303
-
304
-
305
-
306
-
307
-
308
-
309
-
310
-
311
-
312
-
313
-
314
-
315
-
316
-
317
-
318
-
319
-
320
-
321
-
322
-
323
-
324
-
325
-
326
-
327
-
328
-
329
-
330
-
331
-
332
-
333
-
334
-
335
-
336
-
337
-
338
-
339
-
340
-
341
-
342
-
343
-
344
-
345
-
346
-
347
-
348
-
349
-
350
-
351
-
352
-
353
-
354
-
355
-
356
-
357
-
358
-
359
-
360
-
361
-
362
-
363
-
364
-
365
-
366
-
367
-
368
-
369
-
370
 |
 |

TableofContents
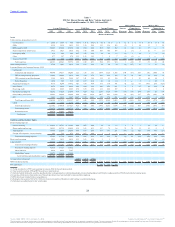
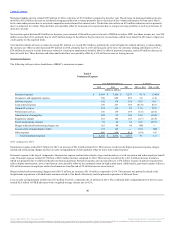
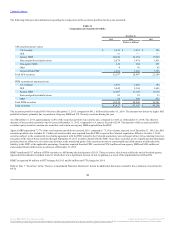
Segment Results
See Note 20 “Operating Segments” in the “Notes to Consolidated Financial Statements” herein for additional disclosures related to BB&T’s operating
segments, the internal accounting and reporting practices used to manage these segments and financial disclosures for these segments.
Fluctuations in noninterest income and noninterest expense incurred directly by the segments are more fully discussed in the “Noninterest Income” and
“Noninterest Expense” sections above.
2015 compared to 2014
Community Banking
Community Banking had a network of 2,139 banking offices at the end of 2015, an increase of 300 offices compared to December 31, 2014. The increase in
offices was primarily driven by the acquisition of 41 branches in Texas, 32 branches with the acquisition of The Bank of Kentucky and 245 branches with the
acquisition of Susquehanna Bancshares, partially offset by the consolidation of nearby financial centers and the closure of certain lower volume branches
within the BB&T branch network.
Community Banking net income was $978 million in 2015, an increase of $68 million, or 7.5%, compared to 2014. Net income results include the impact of
the current year acquisitions as described previously.
Segment net interest income increased $159 million to $3.1 billion, primarily driven by growth in commercial loans and direct retail loans due to organic
growth and the acquisitions, partially offset by lower interest rates on new loans and lower funding spreads on deposits.
Noninterest income decreased $18 million driven by lower service charges on deposits, international factoring commissions and letter of credit fees.
Intersegment net referral fee income increased $15 million driven by higher loan referrals to the Residential Mortgage Banking segment and higher capital
markets referrals to the Financial Services segment.
The allocated provision for credit losses decreased $56 million as a result of lower commercial and retail loan net charge-offs. Noninterest expense increased
$89 million driven by higher salary, incentive, pension and franchise tax expense as well as higher merger-related charges. The increase in salary expense
reflects the acquisition activity. Allocated corporate expense increased $21 million driven by internal business initiatives.
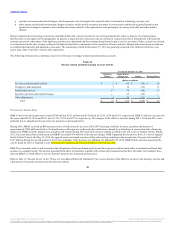
Residential Mortgage Banking
Residential Mortgage Banking net income was $244 million in 2015, an increase of $40 million, or 19.6%, compared to 2014. Mortgage originations totaled
$18.1 billion in 2015, an increase of $706 million compared to $17.4 billion in 2014. BB&T’s residential mortgage servicing portfolio, which includes both
retained loans and loans serviced for others, totaled $122.2 billion at the end of 2015, compared to $122.3 billion at December 31, 2014.
Segment net interest income decreased $46 million to $452 million, primarily the result of lower loans HFI balances reflecting the current strategy of selling
substantially all conforming mortgage loan production, partially offset by higher credit spreads. Noninterest income increased $45 million, driven by higher
gains on residential mortgage loan production and sales and an increase in net MSR income, primarily due to improved MSR hedging results.
The allocated provision for credit losses reflected a charge of $9 million in 2015, compared to a benefit of $107 million in 2014, partially attributable to
stabilization in the rate of improvement in credit trends. Earlier period results reflect the impact of loan sales that generated a combined $66 million in gains
through the release of the related ALLL. Noninterest expense decreased $184 million, primarily due to prior-year adjustments totaling $118 million relating
to the previously discussed FHA-insured loan exposures and a $27 million prior-year charge related to a review of mortgage processes. The decrease in
noninterest expense was also partially attributable to lower costs associated with repurchased loans.
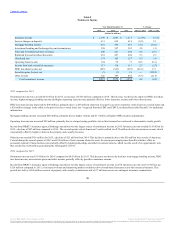
Dealer Financial Services
Dealer Financial Services net income was $180 million in 2015, a decrease of $3 million, or 1.6%, compared to 2014.
39
Source: BB&T CORP, 10-K, February 25, 2016 Powered by Morningstar® Document Research℠
The information contained herein may not be copied, adapted or distributed and is not warranted to be accurate, complete or timely. The user assumes all risks for any damages or losses arising from any use of this information,
except to the extent such damages or losses cannot be limited or excluded by applicable law. Past financial performance is no guarantee of future results.