BB&T 2015 Annual Report Download - page 55
Download and view the complete annual report
Please find page 55 of the 2015 BB&T annual report below. You can navigate through the pages in the report by either clicking on the pages listed below, or by using the keyword search tool below to find specific information within the annual report.-
 1
1 -
2
-
3
-
4
-
5
-
6
-
7
-
8
-
9
-
10
-
11
-
12
-
13
-
14
-
15
-
16
-
17
-
18
-
19
-
20
-
21
-
22
-
23
-
24
-
25
-
26
-
27
-
28
-
29
-
30
-
31
-
32
-
33
-
34
-
35
-
36
-
37
-
38
-
39
-
40
-
41
-
42
-
43
-
44
-
 45
45 -
 46
46 -
 47
47 -
 48
48 -
 49
49 -
 50
50 -
 51
51 -
 52
52 -
 53
53 -
 54
54 -
 55
55 -
 56
56 -
 57
57 -
 58
58 -
 59
59 -
 60
60 -
 61
61 -
 62
62 -
 63
63 -
 64
64 -
 65
65 -
66
-
67
-
68
-
69
-
70
-
71
-
72
-
73
-
74
-
75
-
76
-
77
-
78
-
79
-
80
-
81
-
82
-
83
-
84
-
85
-
86
-
87
-
88
-
89
-
90
-
91
-
92
-
93
-
94
-
95
-
96
-
97
-
98
-
99
-
100
-
101
-
102
-
103
-
104
-
105
-
106
-
107
-
108
-
109
-
110
-
111
-
112
-
113
-
114
-
115
-
116
-
117
-
118
-
119
-
120
-
121
-
122
-
123
-
124
-
125
-
126
-
127
-
128
-
129
-
130
-
131
-
132
-
133
-
134
-
135
-
136
-
137
-
138
-
139
-
140
-
141
-
142
-
143
-
144
-
145
-
146
-
147
-
148
-
149
-
150
-
151
-
152
-
153
-
154
-
155
-
156
-
157
-
158
-
159
-
160
-
161
-
162
-
163
-
164
-
165
-
166
-
167
-
168
-
169
-
170
-
171
-
172
-
173
-
174
-
175
-
176
-
177
-
178
-
179
-
180
-
181
-
182
-
183
-
184
-
185
-
186
-
187
-
188
-
189
-
190
-
191
-
192
-
193
-
194
-
195
-
196
-
197
-
198
-
199
-
200
-
201
-
202
-
203
-
204
-
205
-
206
-
207
-
208
-
209
-
210
-
211
-
212
-
213
-
214
-
215
-
216
-
217
-
218
-
219
-
220
-
221
-
222
-
223
-
224
-
225
-
226
-
227
-
228
-
229
-
230
-
231
-
232
-
233
-
234
-
235
-
236
-
237
-
238
-
239
-
240
-
241
-
242
-
243
-
244
-
245
-
246
-
247
-
248
-
249
-
250
-
251
-
252
-
253
-
254
-
255
-
256
-
257
-
258
-
259
-
260
-
261
-
262
-
263
-
264
-
265
-
266
-
267
-
268
-
269
-
270
-
271
-
272
-
273
-
274
-
275
-
276
-
277
-
278
-
279
-
280
-
281
-
282
-
283
-
284
-
285
-
286
-
287
-
288
-
289
-
290
-
291
-
292
-
293
-
294
-
295
-
296
-
297
-
298
-
299
-
300
-
301
-
302
-
303
-
304
-
305
-
306
-
307
-
308
-
309
-
310
-
311
-
312
-
313
-
314
-
315
-
316
-
317
-
318
-
319
-
320
-
321
-
322
-
323
-
324
-
325
-
326
-
327
-
328
-
329
-
330
-
331
-
332
-
333
-
334
-
335
-
336
-
337
-
338
-
339
-
340
-
341
-
342
-
343
-
344
-
345
-
346
-
347
-
348
-
349
-
350
-
351
-
352
-
353
-
354
-
355
-
356
-
357
-
358
-
359
-
360
-
361
-
362
-
363
-
364
-
365
-
366
-
367
-
368
-
369
-
370
 |
 |

TableofContents
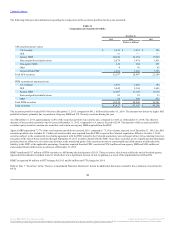
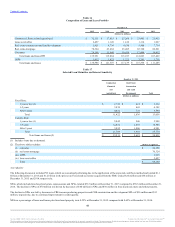
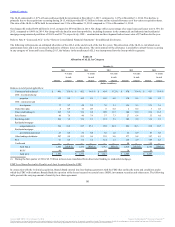
Commercial, financial and agricultural $ 32,211 $ 27,615 $ 25,260 $ 23,863 $ 21,452
Lease receivables 2,497 1,120 1,126 1,114 1,067
Real estate-construction and land development 5,621 4,736 4,630 5,900 7,714
Real estate-mortgage 70,324 63,464 65,485 65,760 60,821
Consumer 24,298 22,949 19,416 17,966 16,415
Total loans and leases HFI 135,951 119,884 115,917 114,603 107,469
LHFS 1,035 1,423 1,222 3,761 3,736
Total loans and leases $ 136,986 $ 121,307 $ 117,139 $ 118,364 $ 111,205
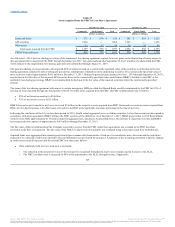
Fixed Rate:
1 year or less (1) $ 2,741 $ 421 $ 3,162
1-5 years 3,859 443 4,302
After 5 years 4,822 772 5,594
Total 11,422 1,636 13,058
Variable Rate:
1 year or less (1) 5,042 946 5,988
1-5 years 12,852 2,033 14,885
After 5 years 3,895 1,006 4,901
Total 21,789 3,985 25,774
Total loans and leases (2) $ 33,211 $ 5,621 $ 38,832
(1) Includes loans due on demand.
(2) The above table excludes:
(i) consumer $ 24,298
(ii) real estate mortgage 70,324
(iii) LHFS 1,035
(iv) lease receivables 2,497
Total $ 98,154
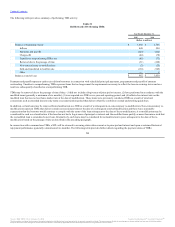
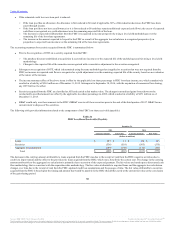
Asset Quality
The following discussion includes PCI loans, which are considered performing due to the application of the expected cash flows method and totaled $1.1
billion at December 31, 2015 and $1.2 billion in the prior year. Foreclosed real estate acquired from the FDIC totaled $26 million and $56 million at
December 31, 2015 and 2014, respectively.
NPAs, which include foreclosed real estate, repossessions and NPLs, totaled $712 million at December 31, 2015 compared to $782 million at December 31,
2014. The decline in NPAs of $70 million was driven by decreases of $40 million in NPLs and $30 million in foreclosed real estate and other property.
The decline in NPLs was led by decreases in CRE-income producing properties and CRE-construction and development NPLs of $36 million and $13
million, respectively, due to continued improvement in credit quality.
.
NPAs as a percentage of loans and leases plus foreclosed property were 0.52% at December 31, 2015 compared with 0.65% at December 31, 2014.
49
Source: BB&T CORP, 10-K, February 25, 2016 Powered by Morningstar® Document Research℠
The information contained herein may not be copied, adapted or distributed and is not warranted to be accurate, complete or timely. The user assumes all risks for any damages or losses arising from any use of this information,
except to the extent such damages or losses cannot be limited or excluded by applicable law. Past financial performance is no guarantee of future results.