BB&T 2015 Annual Report Download - page 116
Download and view the complete annual report
Please find page 116 of the 2015 BB&T annual report below. You can navigate through the pages in the report by either clicking on the pages listed below, or by using the keyword search tool below to find specific information within the annual report.-
 1
1 -
2
-
3
-
4
-
5
-
6
-
7
-
8
-
9
-
10
-
11
-
12
-
13
-
14
-
15
-
16
-
17
-
18
-
19
-
20
-
21
-
22
-
23
-
24
-
25
-
26
-
27
-
28
-
29
-
30
-
31
-
32
-
33
-
34
-
35
-
36
-
37
-
38
-
39
-
40
-
41
-
42
-
43
-
44
-
45
-
46
-
47
-
48
-
49
-
50
-
51
-
52
-
53
-
54
-
55
-
56
-
57
-
58
-
59
-
60
-
61
-
62
-
63
-
64
-
65
-
66
-
67
-
68
-
69
-
70
-
71
-
72
-
73
-
74
-
75
-
76
-
77
-
78
-
79
-
80
-
81
-
82
-
83
-
84
-
85
-
86
-
87
-
88
-
89
-
90
-
91
-
92
-
93
-
94
-
95
-
96
-
97
-
98
-
99
-
100
-
101
-
102
-
103
-
104
-
105
-
 106
106 -
 107
107 -
 108
108 -
 109
109 -
 110
110 -
 111
111 -
 112
112 -
 113
113 -
 114
114 -
 115
115 -
 116
116 -
 117
117 -
 118
118 -
 119
119 -
 120
120 -
 121
121 -
 122
122 -
 123
123 -
 124
124 -
 125
125 -
 126
126 -
127
-
128
-
129
-
130
-
131
-
132
-
133
-
134
-
135
-
136
-
137
-
138
-
139
-
140
-
141
-
142
-
143
-
144
-
145
-
146
-
147
-
148
-
149
-
150
-
151
-
152
-
153
-
154
-
155
-
156
-
157
-
158
-
159
-
160
-
161
-
162
-
163
-
164
-
165
-
166
-
167
-
168
-
169
-
170
-
171
-
172
-
173
-
174
-
175
-
176
-
177
-
178
-
179
-
180
-
181
-
182
-
183
-
184
-
185
-
186
-
187
-
188
-
189
-
190
-
191
-
192
-
193
-
194
-
195
-
196
-
197
-
198
-
199
-
200
-
201
-
202
-
203
-
204
-
205
-
206
-
207
-
208
-
209
-
210
-
211
-
212
-
213
-
214
-
215
-
216
-
217
-
218
-
219
-
220
-
221
-
222
-
223
-
224
-
225
-
226
-
227
-
228
-
229
-
230
-
231
-
232
-
233
-
234
-
235
-
236
-
237
-
238
-
239
-
240
-
241
-
242
-
243
-
244
-
245
-
246
-
247
-
248
-
249
-
250
-
251
-
252
-
253
-
254
-
255
-
256
-
257
-
258
-
259
-
260
-
261
-
262
-
263
-
264
-
265
-
266
-
267
-
268
-
269
-
270
-
271
-
272
-
273
-
274
-
275
-
276
-
277
-
278
-
279
-
280
-
281
-
282
-
283
-
284
-
285
-
286
-
287
-
288
-
289
-
290
-
291
-
292
-
293
-
294
-
295
-
296
-
297
-
298
-
299
-
300
-
301
-
302
-
303
-
304
-
305
-
306
-
307
-
308
-
309
-
310
-
311
-
312
-
313
-
314
-
315
-
316
-
317
-
318
-
319
-
320
-
321
-
322
-
323
-
324
-
325
-
326
-
327
-
328
-
329
-
330
-
331
-
332
-
333
-
334
-
335
-
336
-
337
-
338
-
339
-
340
-
341
-
342
-
343
-
344
-
345
-
346
-
347
-
348
-
349
-
350
-
351
-
352
-
353
-
354
-
355
-
356
-
357
-
358
-
359
-
360
-
361
-
362
-
363
-
364
-
365
-
366
-
367
-
368
-
369
-
370
 |
 |

TableofContents
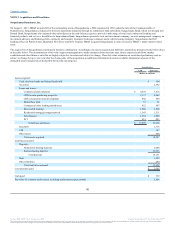
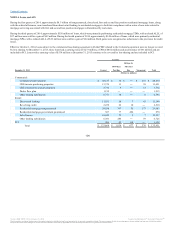
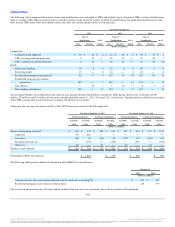
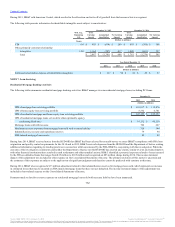
Commercial:
Commercial and industrial $ 41,192 $ 23 $ ― $ 239 $ 41,454
CRE-income producing properties 10,644 4 ― 74 10,722
CRE-construction and development 2,708 1 ― 26 2,735
Dealer floor plan 1,091 ― ― ― 1,091
Other lending subsidiaries 5,337 15 ― 4 5,356
Retail:
Direct retail lending 8,045 41 12 48 8,146
Revolving credit 2,428 23 9 ― 2,460
Residential mortgage-nonguaranteed 29,468 392 83 164 30,107
Residential mortgage-government guaranteed 251 82 648 2 983
Sales finance 9,437 62 5 5 9,509
Other lending subsidiaries 5,830 222 ― 54 6,106
PCI 994 33 188 ― 1,215
Total $ 117,425 $ 898 $ 945 $ 616 $ 119,884
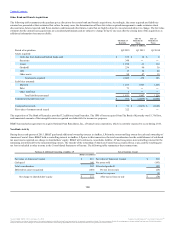
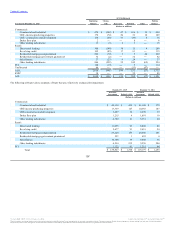
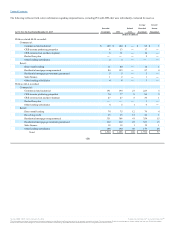
The following tables present the carrying amount of loans by risk rating. PCI loans are excluded because their related ALLL is determined by loan pool
performance.
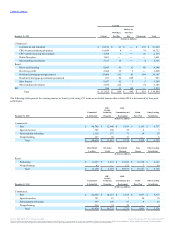
Commercial:
Pass $ 46,760 $ 12,940 $ 3,619 $ 1,195 $ 6,757
Special mention 305 166 29 6 3
Substandard-performing 1,128 277 71 14 29
Nonperforming 237 38 13 ― 6
Total $ 48,430 $ 13,421 $ 3,732 $ 1,215 $ 6,795
Retail:
Performing $ 11,097 $ 2,510 $ 30,360 $ 10,320 $ 6,667
Nonperforming 43 ― 173 7 59
Total $ 11,140 $ 2,510 $ 30,533 $ 10,327 $ 6,726
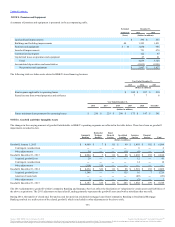
Commercial:
Pass $ 40,055 $ 10,253 $ 2,615 $ 1,037 $ 5,317
Special mention 163 67 7 50 10
Substandard-performing 997 328 87 4 25
Nonperforming 239 74 26 ― 4
Total $ 41,454 $ 10,722 $ 2,735 $ 1,091 $ 5,356
Source: BB&T CORP, 10-K, February 25, 2016 Powered by Morningstar® Document Research℠
The information contained herein may not be copied, adapted or distributed and is not warranted to be accurate, complete or timely. The user assumes all risks for any damages or losses arising from any use of this information,
except to the extent such damages or losses cannot be limited or excluded by applicable law. Past financial performance is no guarantee of future results.